Describe the information in the table and make comparisons where appropriate. Write at least 150 words.
Sample Answer of Describe the Information in the Table and Make Comparisons Where Appropriate
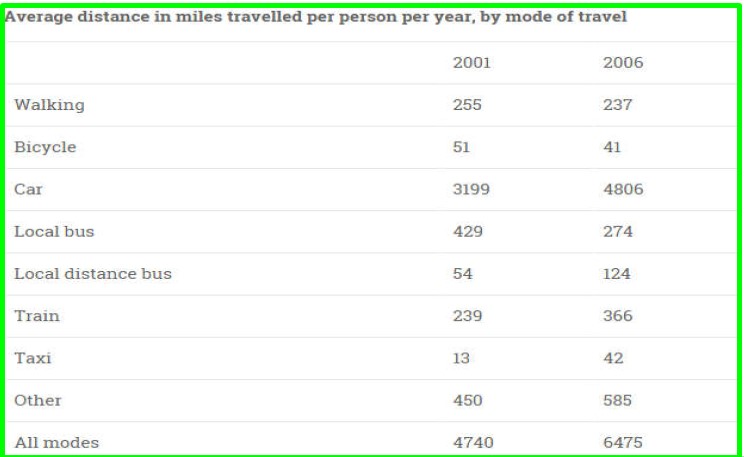
The provided table demonstrates the per person average travelled distance which measures in miles, 8 different travel modes compared it to 2001 and 2006.
Overall, in both the years per person the highest covered distance was by car whereas, least are by bicycle and taxi, in 2001 average distance miles was 4740 that was increased to 6475 after 5 years.
In 2001, a person walks an average of 255 miles per year while by train they travel 239 miles which were roughly half than another travelling way, the majority of distance cover by car on account of 3199 miles, however, the taxi was considered only 13 miles per year. Additionally, per year only 51 miles travelled by bicycle, 54 miles local distance bus, via local bus 110 more miles travelled than trains.
In 2006, with 4806 miles car was most preferred travel mode while bicycle and taxi were on least choice around 41 miles. Local bus average distance was fallen by nearly 50 miles although local distance bus miles increased above the double miles. No big difference for travel by walking, another mode of transportation and train had 585miles and 366 miles respectively.