The table gives information about five types of vehicles registered in Australia in 2010, 2012 and 2014. Summarise the information by selecting and reporting the main features, and make comparisons where relevant.
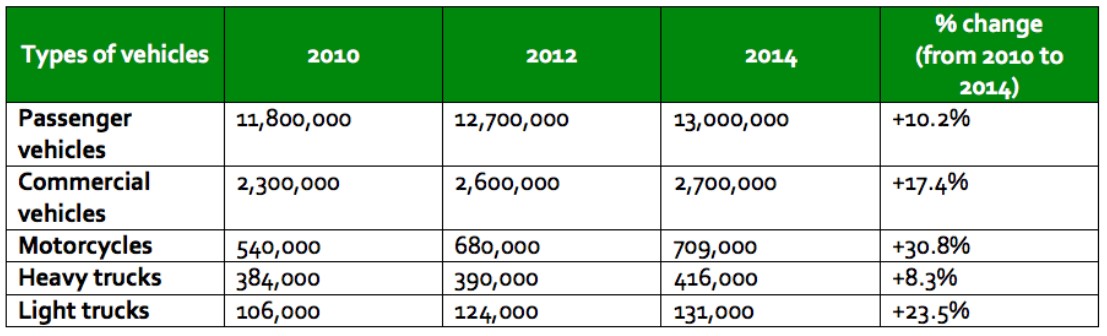
The yielded table illustrates the number and percentage of change of five different transportation modes in Australia in 2010, 212 and 2014.
Overall, year by year registered vehicle number rose in all types of vehicles in addition, throughout the period passenger vehicles had the most vehicles although, light trucks had the least.
For passengers vehicles, 11,800,000 vehicles were in 2010; it goes upwardly later. To reaching 13,000,000 only 6 years taken, percentage of change was one in tenth. For motorcycles, the number of this vehicle was 540000 in 2012, after two years it jumps up 140000, in 2014 had 709000 and six years change was the zenith, one-third proportion. For light trucks, with the least vehicle, it had only 106000 in 2010, this number was 131000 in 2014 although, changes percentage was second-highest on account of a quarter.
For commercial vehicles, with the second position in 2010, 2300,000 registered vehicles were in this category it climbed continually 200,000 after 2 years gap. 17.4% changed percentage. For heavy trucks, in 2012, the number was 384000 and grew slowly to 390000 and 416000 in 2012, 2014 respectively. 8.3% changed proportion.
Follow Us on IELTSFever Instagram for more updates and the latest test tasks.
Also, Read The Pie Chart Gives Information About the Country of Birth of People