The Diagrams Show a Museum and Its Surroundings in 1990 and 2010

The Diagrams Show a Museum and Its Surroundings in 1990 and 2010

The Diagrams Show a Museum and Its Surroundings in 1990 and 2010. Summarise the Information by Selecting and Reporting the Main Features, and Make Comparisons Where Relevant. The given diagrams depict the information about the museum and its surroundings between 1990 and 2010. 🌍 Overall, it can be seen that there were huge changes. It is […]

The Diagrams Show a Museum and Its Surroundings in 1990 and 2010 Read More »

The graph below shows the changes in the maximum number of Asian

The graph below shows the changes in the maximum number of Asian

The graph below shows the changes in the maximum number of Asian elephants between 1994 and 2007. Summarise the information by selecting and reporting the main features, and make comparisons where relevant. Write at least 150 words. Sample 1: The graph below shows the changes in the maximum number of Asian The changes in the

The graph below shows the changes in the maximum number of Asian Read More »

Many Cities Are Now Turning Parks and Farmland Into New Housing Developments

Many Cities Are Now Turning Parks and Farmland Into New Housing Developments

Many Cities Are Now Turning Parks and Farmland Into New Housing Developments. Is This a Positive or Negative Development? Turning parks and farmland into new housing developments is neither positive nor negative, but it can also be both positive and negative. We all know that the population has been increasing over the years. Different daily demands

Many Cities Are Now Turning Parks and Farmland Into New Housing Developments Read More »

The Bar Charts Below Show the Marriage and Divorce Statistics for Eight Countries

The Bar Charts Below Show the Marriage and Divorce Statistics for Eight Countries

The Bar Charts Below Show the Marriage and Divorce Statistics for Eight Countries in 1981 and 1994. Write a Short Report for A University Lecturer Describing the Information Shown Below. Sample 1: The Bar Charts Below Show the Marriage and Divorce Statistics for Eight Countries The rendered vertical bar graph elucidates the comparison of marriage

The Bar Charts Below Show the Marriage and Divorce Statistics for Eight Countries Read More »

Some University Students Want to Learn About Other Subjects Besides

Some University Students Want to Learn About Other Subjects Besides

Some University Students Want to Learn About Other Subjects Besides Their Main Subjects. Others Believe It Is More Important to Give All Their Time and Attention to Studying for A Qualification. Discuss Both These Views and Give Your Own Opinion. In so many Nations globally, the influx of people from the villages to the urban

Some University Students Want to Learn About Other Subjects Besides Read More »

IELTSFever FREE Online Mock Test Day 780 Recent IELTS Exam Tests

IELTSFever FREE Online Mock Test Day 780 Recent IELTS Exam Tests

IELTSFever FREE Online Mock Test Day 780 Recent Exam Tests Must Read These Instructions Before Participating in Exam. The answer to every question is mandatory; otherwise, we will not accept it. Send your answers to [email protected] with your name and city along with the question Test Number, like IELTSFever FREE Online Mock Test Day 780

IELTSFever FREE Online Mock Test Day 780 Recent IELTS Exam Tests Read More »

The Chart Below Gives Information About Global Population Percentages and The Distribution

The Chart Below Gives Information About Global Population Percentages and The Distribution

The Chart Below Gives Information About Global Population Percentages and The Distribution of Wealth by Region. Summarise the Information by Selecting and Reporting the Main Features, and Make Comparisons Where Relevant. Write at Least 150 Words. Sample 1 : The Chart Below Gives Information About Global Population Percentages and The Distribution The bar graph displays

The Chart Below Gives Information About Global Population Percentages and The Distribution Read More »

The Line Graph Shows Paris Metro Station Passengers: AC Writing Task 1

The Line Graph Shows Paris Metro Station Passengers

The Line Graph Shows Paris Metro Station Passengers. Summarise the Information by Selecting and Reporting on The Main Features, and Make Comparisons Where Relevant. Write at least 150 Words. Sample 1: The Line Graph Shows Paris Metro Station Passengers The data on passengers at the Paris Metro station are illustrated in the line graph. Overall,

The Line Graph Shows Paris Metro Station Passengers: AC Writing Task 1 Read More »

IELTSFever FREE Online Mock Test Day 779 Recent IELTS Exam Tests

IELTSFever FREE Online Mock Test Day 779 Recent IELTS Exam Tests

IELTSFever FREE Online Mock Test Day 779 Recent Exam Tests Must Read These Instructions Before Participating in Exam. The answer to every question is mandatory; otherwise, we will not accept it. Send your answers to [email protected] with your name and city along with the question Test Number, like IELTSFever FREE Online Mock Test Day 779

IELTSFever FREE Online Mock Test Day 779 Recent IELTS Exam Tests Read More »

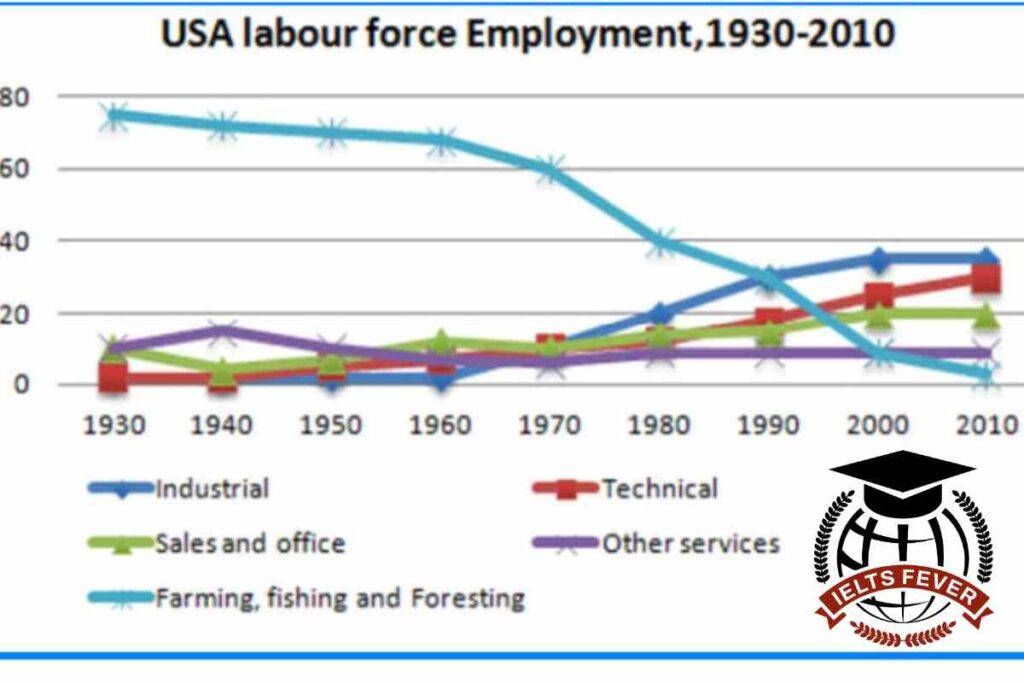
The Graph Below Presents the Employment Patterns in The USA Between 1930 and 2010

The Graph Below Presents the Employment Patterns in The USA Between 1930 and 2010

The Graph Below Presents the Employment Patterns in The USA Between 1930 and 2010. Summarise the Information by Selecting and reporting in The Main Features, and Make Comparisons Where Relevant. Write at least 150 Words. Sample 1: The Graph Below Presents the Employment Patterns in The USA Between 1930 and 2010 The graph below presents

The Graph Below Presents the Employment Patterns in The USA Between 1930 and 2010 Read More »

The Two Bar Charts Show the Proportion of 14-16-year-old Students Studying

The Two Bar Charts Show the Proportion of 14-16-year-old Students Studying

The Two Bar Charts Show the Proportion of 14-16-year-old Students Studying a Modern Foreign Language in An English-speaking country and The Top Three Popular Foreign Languages. Summarise the Information by Selecting and Reporting the Main Features and Making Comparisons Where Relevant. The two bar charts illustrate the number of children who learned to speak foreign

The Two Bar Charts Show the Proportion of 14-16-year-old Students Studying Read More »

Scroll to Top