The bar graph indicates sales figures for reading materials from 2002 to 2012. Write a report to a university lecturer describing the information shown below. Write at least 150 words
Sample Answer of The Bar Graph Indicates Sales Figures for Reading Materials From 2002 to 2012
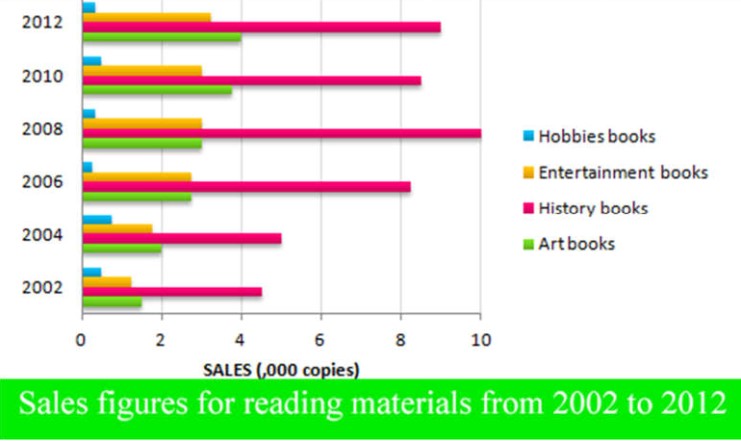
The graph illustrates the expenditure on different reading materials for 2002 to 2012.
Overall, it can be seen the sales for the history books is the highest while the hobbies books cater to the least expenses. The expenses made on the entertainment books and art books can be seen on an equal scale.
The sale for the history books was started at around 4500 copies in 2002 which increased to 5000 copies in 2004. There was a gradual increase in the sale of history books till the year 2008 with 10000 copies annually but after the sale fluctuated till 2012. The hobbies books saw the least sale since the initial year, and the sales fluctuated till the year 2012 with the number of copies being sold below 1000 for all the respective years.
The trade for art books was 1800 and 2000 copies in the year 2002 and 2004 respectively while the entertainment books sold for 1600 and 1800 in the year 2002 and 2004 respectively. The expenditure for both the categories was equal to 2400 and 2500 in the year 2006 and 2008. The same was increased in the following years ahead.
The people were fond of reading history rather than any kind of hobby books.
Follow Us on Twitter IELTSFever