academic writing task 1

The Diagrams Below Show the Main Reasons Workers Chose to Work from Home

The Diagrams Below Show the Main Reasons Workers Chose to Work from Home (1)

The diagrams below show the main reasons workers chose to work from home and the hour’s males and females worked at home for the year 2019. Summarise the information by selecting and reporting the main features, and make comparisons where relevant. Sample Answer of The Diagrams Below Show the Main Reasons Workers Chose to Work […]

The Diagrams Below Show the Main Reasons Workers Chose to Work from Home Read More »

The Table Shows the Worldwide Market Share of The Mobile Phone Market

The Table Shows the Worldwide Market Share of The Mobile Phone Market (2)

The table shows the worldwide market share of the mobile phone market for manufactures in the years 2005 and 2006. Summarise the information by selecting and reporting the main features, and make comparisons where relevant. The table chart illustrates the global sales of the cell phone market for manufacturing between 2005 and 2006 years. The

The Table Shows the Worldwide Market Share of The Mobile Phone Market Read More »

The Graph Describes The Changes in Medical Funding in Four Countries

The Graph Describes The Changes in Medical Funding in Four Countries (1)

The graph describes the changes in Medical Funding in four countries from 2010 to 2018. Summarise the information by selecting and reporting the main features, and make comparisons where relevant. The yielded bar charts illustrate four different countries medical funding changes between 2010 and 2018; the funding measurements unit was millions of dollars. Overall, it

The Graph Describes The Changes in Medical Funding in Four Countries Read More »

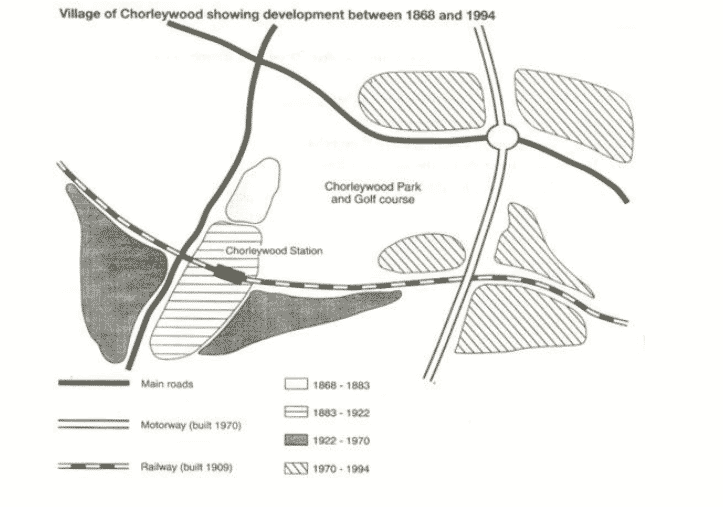
growth of a village called Chorleywood between 1868 and 1994.

The map shows the growth of a village called Chorleywood between 1868 and 1994. Answer of the Academic Writing Task The map shows the growth of a village called Chorleywood between 1868 and 1994. The figure shows the rising of a village named Chorleywood in 1868-1994. Development works in village were done in different periods

growth of a village called Chorleywood between 1868 and 1994. Read More »

Information About Changes in Modes of Travel in England Between 1985 and 2000.

Information About Changes in Modes of Travel in England Between 1985 and 2000. Year

The table below gives information about changes in modes of travel in England between the Year 1985 and 2000. Write in 150 words Sample Answer of Information About Changes in Modes of Travel in England Between 1985 and 2000. The tabular chart elucidates the information regarding the average distances that individuals in Britain travel using

Information About Changes in Modes of Travel in England Between 1985 and 2000. Read More »

The Vertical Bar Graph Manifest the Information Regarding the Fertility Rates of Females.

The Vertical Bar Graph Manifest the Information Regarding the Fertility Rates of Females

The Vertical Bar Graph Manifest the Information Regarding the Fertility Rates of Females. Sample Answer The vertical bar graph manifests the information regarding the fertility rates of females in 6 distinct Gulf Nations namely, Bahrain, Kuwait, Oman, Saudi Arabia, and UAE during 1990 and 2000. Overall, the most eye-catching feature is that the birth rate

The Vertical Bar Graph Manifest the Information Regarding the Fertility Rates of Females. Read More »

Scroll to Top