The Line Graph Below Shows the Percentage of Female
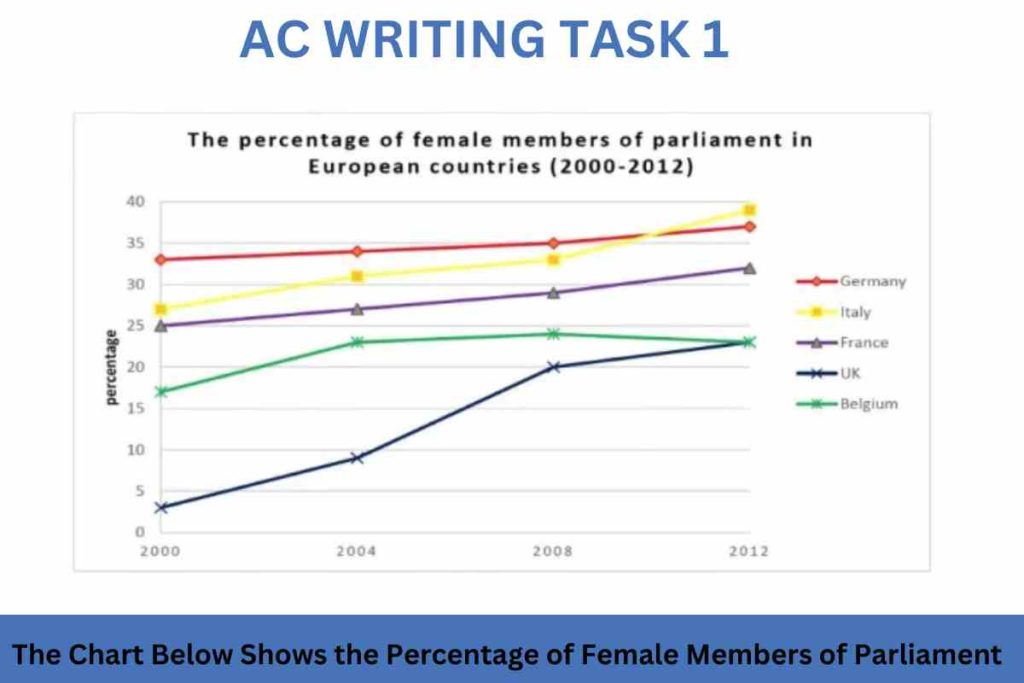
The Line Graph Below Shows the Percentage of Female Members of Parliament in 5 European countries from 2000 to 2012. Summarize the information by selecting and reporting the main features, and make comparisons where relevant. Sample 1:- The line graph Below Shows the Percentage of Female Members of Parliament The line graph depicts the women’s […]
The Line Graph Below Shows the Percentage of Female Read More »