The Chart Below Shows the Number of Incidents and Injuries
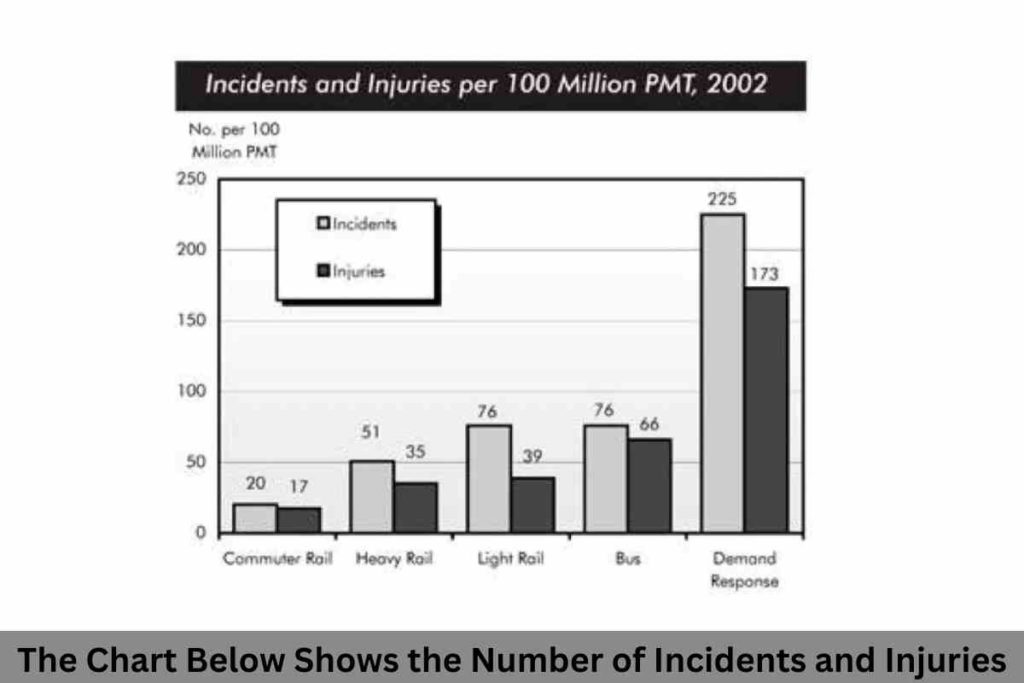
The chart below shows the number of incidents and injuries per 100 million passenger miles traveled (PMT) by transportation type in 2002. Summarise the information by selecting and reporting the main features and make comparisons where relevant. Sample 1:-The Chart Below Shows the Number of Incidents and Injuries The given bar chart depicts how many […]
The Chart Below Shows the Number of Incidents and Injuries Read More »