The Table Chart Illustrates the Milk Production in A Year
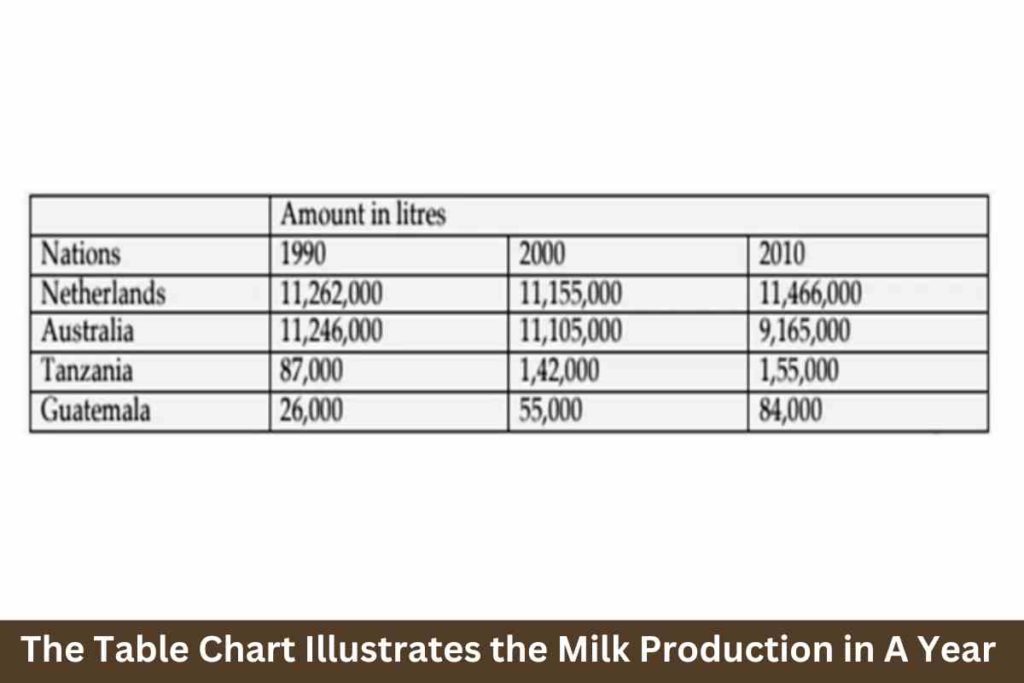
The table chart illustrates the milk production in a year in four countries (Armenia, Norway, Italy, and German) in 1980, 2000, and 2020. Summarise the information by selecting and reporting the main features, and make comparisons where relevant. Sample 1:-The Table Chart Illustrates the Milk Production in A Year The table charts compare the production […]
The Table Chart Illustrates the Milk Production in A Year Read More »