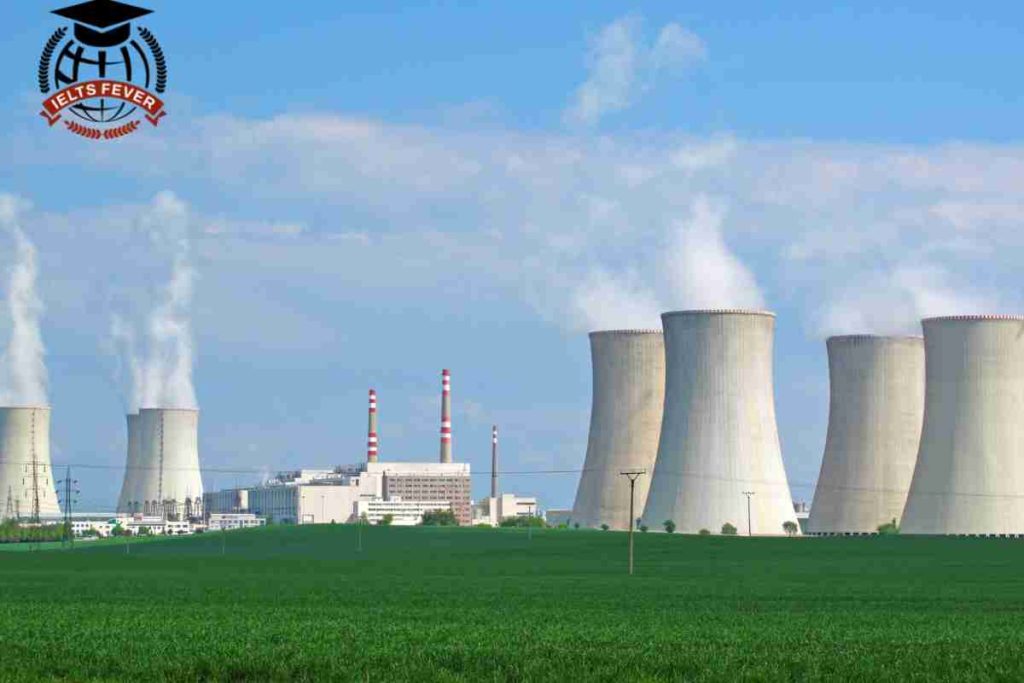
The Pie Charts Show Information About Energy Production in A Country in Two Separate Years
The pie charts show information about energy production in a country in two separate years. Summarise the information by selecting and reporting the main features, and making comparisons where relevant. Sample 1 The Pie Charts Show Information About Energy Production in A Country in Two Separate Years The pie charts depict the contribution of different […]

