The pie charts show the electricity generated in Germany and France
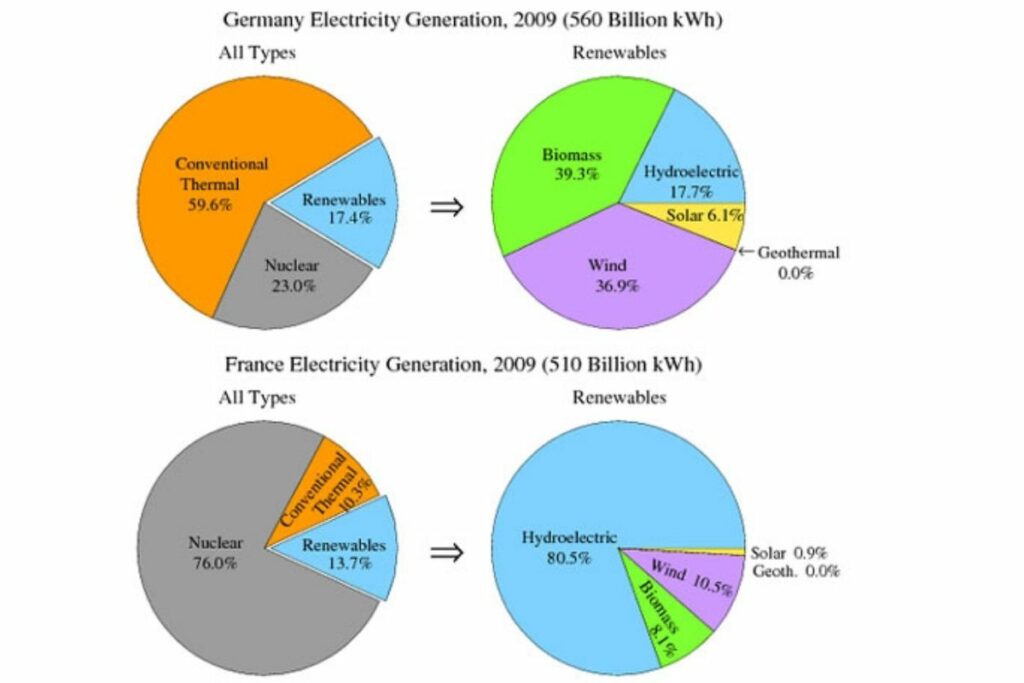
You should spend about 20 minutes on this task. The pie charts show the electricity generated in Germany and France from all sources and renewables in the year 2009. Summarise the information by selecting and report in the main features, and make comparisons where relevant. Write at least 150 words Sample 1 The Pie Chart depicts the electricity produced […]
The pie charts show the electricity generated in Germany and France Read More »