


The bar chart below shows the hours per week that teenagers spend doing certain activities in Chester from 2002 to 2007.

The bar chart elucidates how long per week the activities performed by youngsters at Chester between 2002 and 2007.
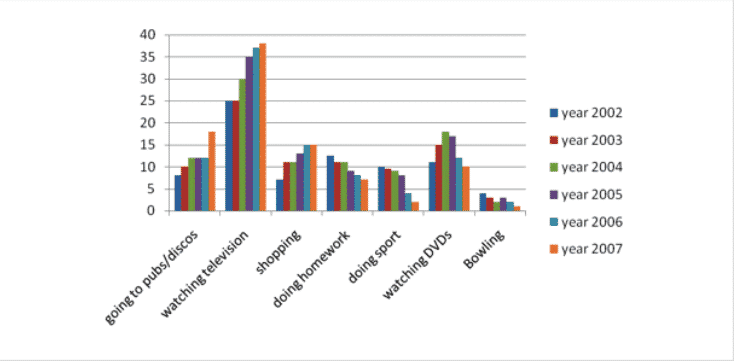
Overall, it is clear from the given graph that going to pubs, watching television and shopping showed an upward trend while doing homework, doing sport and bowling experienced a downward trend. Watching DVDs had fluctuations throughout the period.
In the initial years 2002 and 2003, the hours spent per week going to pubs and disco were around 5 and 10 hours respectively. After that from 2004 to 2006, the figure remained constant at around 13 hours. At the end of the period, it showed a slight increase of around 4 hours. Watching television was the most favorable pursuit among adolescents. In 2002 and 2003 it stood at 25 hours which in the following years increased gradually and finished at below 38 hours per week. Shopping also showed a considerable rise throughout the period. It started at more than 7 hours and ended at 15 hours per week in 2007.
Doing homework and sport kept on declining gradually, In 2002 these were about 13 and 10 hours and at the end, these stood at around 6 and 2 hours respectively. Watching DVDs showed fluctuations throughout the period, in the beginning nearly 10 hours were devoted to it, and in the last year, it returned at 10 hours again. Bowling was the least pursued hobby, 5 hours per week was given to it by kids then it reached to 2 hours per week in 2007.
So This is Sample Answer of The bar chart below shows the hours per week that teenagers spend doing certain activities in Chester from 2002 to 2007.