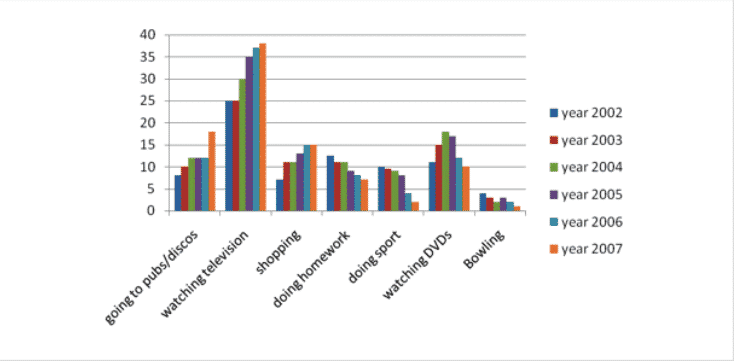
The bar chart below shows the hours per week that teenagers spend doing certain activities in Chester from 2002 to 2007.
 You should spend about 20 minutes on this task.
The bar chart elucidates how long per week the activities performed by youngsters at Chester between 2002 and 2007.
Overall, it is clear from the given graph that going to pubs, watching television and shopping showed an upward trend while doing homework, doing sport and bowling experienced a downward trend. Watching DVDs had fluctuations throughout the period.
In the initial years 2002 and 2003, the hours spent per week going to pubs and disco were around 5 and 10 hours respectively. After that from 2004 to 2006, the figure remained constant at around 13 hours. At the end of the period, it showed a slight increase of around 4 hours. Watching television was the most favorable pursuit among adolescents. In 2002 and 2003 it stood at 25 hours which in the following years increased gradually and finished at below 38 hours per week. Shopping also showed a considerable rise throughout the period. It started at more than 7 hours and ended at 15 hours per week in 2007.
Doing homework and sport kept on declining gradually, In 2002 these were about 13 and 10 hours and at the end, these stood at around 6 and 2 hours respectively. Watching DVDs showed fluctuations throughout the period, in the beginning nearly 10 hours were devoted to it, and in the last year, it returned at 10 hours again. Bowling was the least pursued hobby, 5 hours per week was given to it by kids then it reached to 2 hours per week in 2007.
So This is Sample Answer of The bar chart below shows the hours per week that teenagers spend doing certain activities in Chester from 2002 to 2007.
The Bar Chart depicts the hours per week minors spend in various leisure activities in Chester from 2002
to 2007.
According to the chart, it is crystal clear that adolescent who engage most in watching television
recorded the highest percentage whilst the other categories that engage in visiting pubs/ discos,
shopping, doing homework, doing sports and watching DVDs are 5%, 10% and 17% respectively.
However, it is noted that the least categories of young person that engage in bowling recreational
activities was estimated below 5%.
The graph represents the no. of hours spent by teenagers on various activities from the year 2002 to 2007 for a week.
Discos and pubs were in much greater demand in the year 2007 and on an average they spent approximately 17 to 18 hrs there. On the contrary, in the year 2007, teenagers spent only 7 to 8 hrs there. Similarly, watching television was popular among them in 2007, while in 2002 and 2003 they used to spend 25 hrs only. They spent 15 hrs on shopping for the year 2006 and 2007, while in 2002, shopping constituted for approximately 6 hrs. In the year 2002, millennials spent about 12 hours on their homework whereas in 2007, this was reduced to approximately 7 hours. For sports, we see a very steep decline from 10 hours in 2002 to only 2-3 hours in the year 2007. Due to the huge popularity of blockbuster and then its downfall, thanks to movies and television streaming services such as netflix, we see a growth in the hours spent watching dvd in the year 2004 and its decrease in the year 2007. Bowling never became a major activity in the life of a teenager with only 2 hours spent per week in the year 2007.