The bar chart below shows the numbers of men and women attending various evening courses at an adult education centre in the year 2009. The pie chart gives information about the ages of these course participants. Summarize the information by selecting and reporting the main features, and make comparisons where relevant.
The number of men and women who enrolled for the course at adult education institute is illustrated by given bar chart in the year 2009. Additionally, the pie chart shows the ages of enrolled students for the course.
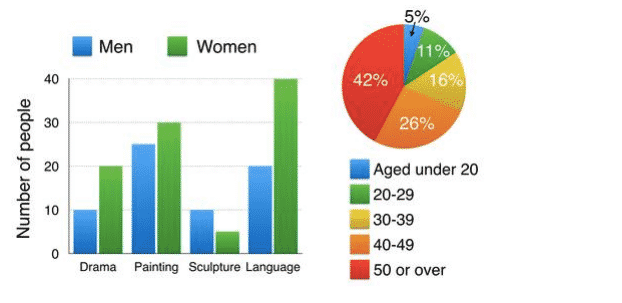
Overall, the majority of people selected language and painting as their mainstream, while sculpture is the least enrolled subject, and data of the ages depicts the most enrolment done by the people who have age more than 50 years. On the other hand, young people have the least participation.
First of all, from the given graph we can see that the number of females who are doing a course in literature, painting and drama are 40, 30 and 20 respectively, but for sculpture, numbers plunged to only 5. Secondly, the highest number of male candidates enjoying painting, which is 25, besides 20 men studying the language. Further, the number reduced by half drama and sculpture.
Furthermore, senior people accounted for almost 42% of all candidates. A quarter of people belong to the age group of 40-49 years and a number varying between 10 to 20 for the age group of 20-39. Shockingly, only a fraction of young candidates participated in the course.
Follow Us on IELTSFever Twitter for more updates
Also read: The Bar Charts Below Provide Information About Honey Production