 Sample 1: The Bar Charts Below Show the Marriage and Divorce Statistics for Eight Countries
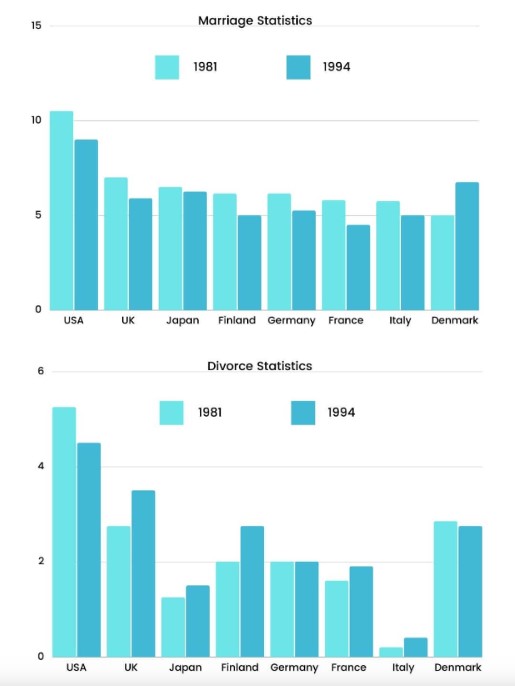
The rendered vertical bar graph elucidates the comparison of marriage and divorce figures for 8 worldwide between 1981 and 1994.
By taking a general overview, it is clearly seen that the United States of America had the highest rate of marriage and divorce statistics in a given span.
In a primary bar chart, in 1981, the USA accounted for the highest marriage statistics as compared to other countries, which were more than 10 per thousand, while it was recorded as less than 10000 in 1994. Other you are a been countries like United Kingdom final line France Italy Denmark marriage rate was around 6 per thousand in 1981 but in 1994 these countries were followed the zigzag trend. There is little difference between the two years in Japan’s marriage statistics, whereas the lowest marriage rate was observed in France in 1994 compared to 1981.
In the Secondary graph, the USA witnessed the highest divorce figures in a given time period, which was above four per thousand. Divorce statistics were maximum in 1981 and 1994, followed by the UK, and Finland was less than two per thousand. The divorce statistics of Germany stagnated for a given duration of 2 2 per thousand. France’s divorce figures increased slightly in 1994 compared to 1981. Moreover, divorce statistics in Denmark were almost similar between 981 and 1994.
Follow Us On IELTSFever Facebook Page For More Updates
Sample 2:The Bar Charts Below Show the Marriage and Divorce Statistics for Eight Countries
The bar charts illustrate the marriage and divorce statistics for eight countries from 1981 to 1994. Overall, they show negligible changes in marriage and divorce rates over time.
Firstly, the USA has the highest marriage rate. The remaining seven countries share a more or less equal rate of marriage over the year. Exceptionally, Denmark’s statistics increased after 1981, whereas other countries face declining marriage rates.
Secondly, the divorce rate is reported to be high in the USA, followed by the UK, Denmark, Finland, Germany, France, Japan, and Italy. From this data, Italy was reported as having the lowest divorce rate. Countries show that the divorce rate has increased over the period, except the USA and Denmark.
In conclusion, the graphs show that the rate of Marriage decreased while divorce increased over the period.
Pages Content
Discover more from IELTS Fever
Subscribe to get the latest posts sent to your email.