The Chart Below Shows the Proportion of Businesses Making E-Commerce Purchases by Industry in Canada Between 2015 and 2019. Summarise the Information by Selecting and Reporting the Main Features, and Make Comparisons Where Relevant.
 Sample Answer of The Chart Below Shows the Proportion of Businesses Making E-Commerce Purchases by Industry in Canada Between 2015 and 2019.
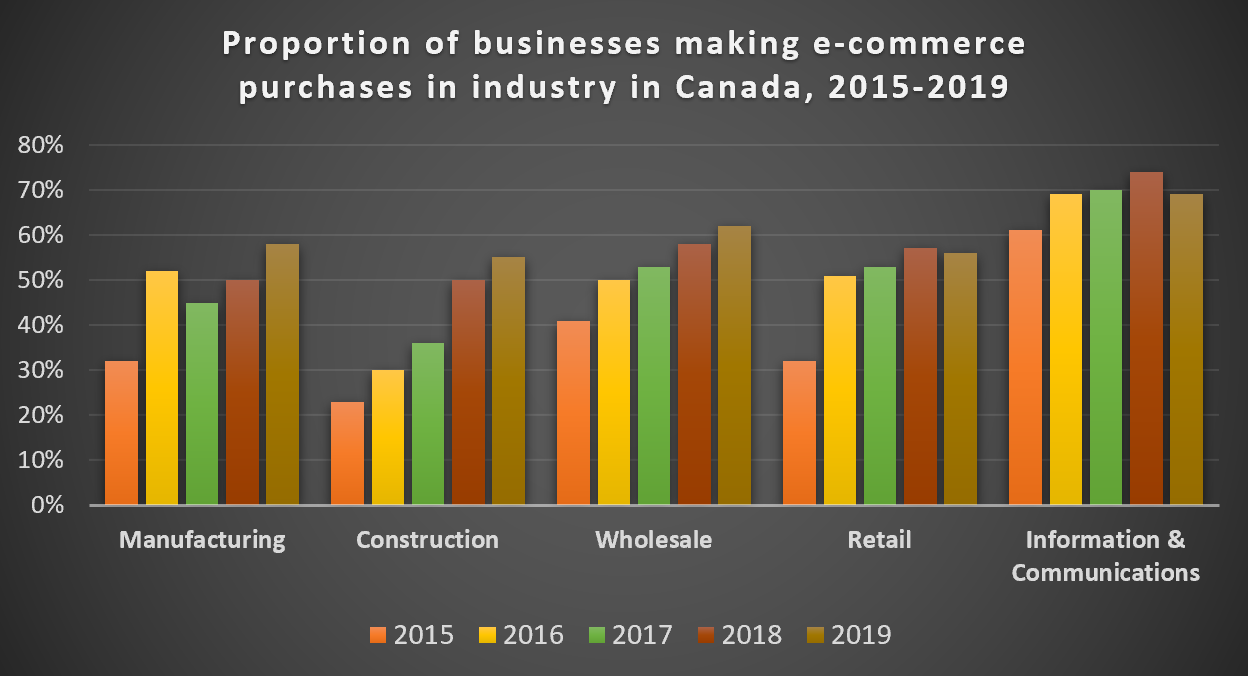
The graph demonstrates the variations of trading making e-commerce purchases by industry in Canada over the five years from 2015 to 2019.
Overall, despite the fluctuating period in the manufacturing business, other businesses have been elevated in direct proportion to time.
An erratic period occurred in the manufacturing sector, with the fewest purchases at approximately 31%, while the highest peak was below 60%. Negligible increases occurred in construction and wholesale tool places throughout the time, with a maximum of around 55 and 61 per cent in 2019, respectively.
However, Retail initially escalated from 2015 to 2016 at 50% and above, then went through a considerable inclination up to 57% in 2018, followed by a decline in 2019 at 56%. Furthermore, information and communications rose insignificantly between 2015 and 2018 but went down in 2019.
Follow Us on the IELTSFever Facebook Page For More Updates
Discover more from IELTS Fever
Subscribe to get the latest posts sent to your email.