


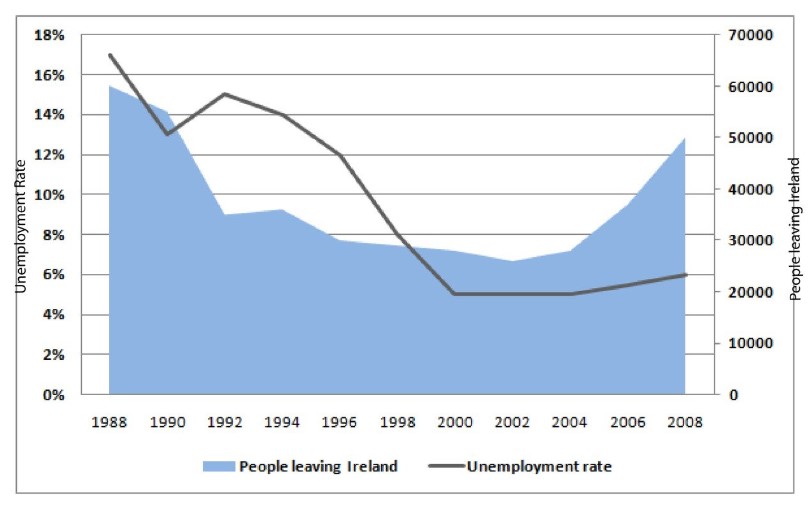

📊 The graph illustrates the unemployment rate and the number of individuals who emigrated from Ireland between 1988 and 2008. The unemployment rate is measured in percentage, while emigration figures are given in terms of the number of people.
🔍 Overall, it is clear that the unemployment rate declined significantly over the given period, while the highest number of people left Ireland in 1988.
📉 In 1988, the unemployment rate was approximately 17%. Over the following three years, it declined sharply to around 13% by 1992. Although there was a slight increase to 15%, the rate then fell dramatically to about 6% by 2000 and remained stable at that level through 2008.
🚶♂️ Regarding emigration, approximately 60,000 people left Ireland in 1988, which was the highest point on the graph. This number then dropped significantly to around 35,000 by 1992. The figure continued to decrease gradually, reaching below 30,000 in 2004. However, by 2008, the number of people emigrating rose again to approximately 50,000.
📌 In summary, while unemployment steadily declined after peaking in 1988, emigration followed a similar trend, dropping until 2004 before rising again towards the end of the period.
Follow Us on The IELTSFever Facebook Page for more updates
✅ Band 8+ IELTS Tips:
- Use precise vocabulary: rose sharply, declined gradually, remained stable.
- Keep tenses consistent (past simple is best for historical data).
- Don’t overuse words like “drastically” or “majority”—replace them with specific numbers or more precise terms when available.