The Chart Shows the Average Life Expectancy for Males and Females in 1990, 1950 and 1990. Summarise the Information by Selecting and Reporting the Main Features and Making Comparisons Where Relevant.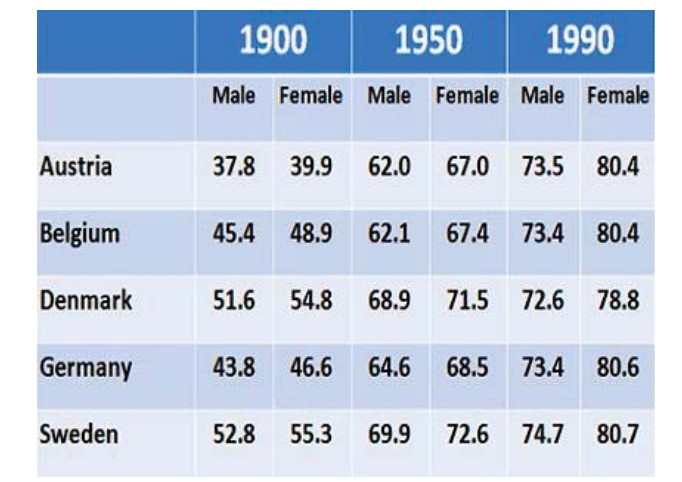
Sample 1: The Chart Shows the Average Life Expectancy for Males and Females
The table provides data on men’s and women’s lifespans in 1900, 1950, and 1990. Overall, the data shows an increase in life expectancy in five countries.
In those given years, Sweden’s male and female life expectancy has always been higher than that of other countries. The lowest was Austria in 1900 and 1950 and Denmark in 1990. Denmark had the second-highest lifespan in 1900 and 1950, and Austria in 1990.
Belgium and Germany have shared the countries with the third and fourth highest lifespans over the years. To sum up, the data shows that, in all these years, women have had the highest life expectancy compared to men.
Follow Us On IELTSFever Facebook Page For More Updates
Sample 2: The Chart Shows the Average Life Expectancy for Males and Females
The table provides comprehensive data on the lifespans of men and women in five countries for the years 1900, 1950, and 1990. A general upward trend in life expectancy is observed across all the countries throughout the given periods.
In each of these years, Sweden stands out with the highest life expectancy for both men and women, consistently surpassing the other countries. In contrast, Austria recorded the lowest life expectancy in 1900 and 1950, while Denmark fell to the lowest position in 1990. Interestingly, Denmark held the second-highest lifespan in 1900 and 1950, only to be replaced by Austria in this rank by 1990.
Belgium and Germany have alternated between the third and fourth positions in terms of life expectancy over the years. This consistent placement indicates a relatively stable health environment compared to the other countries, though still lagging behind Sweden and Denmark.
A notable trend from the data is the consistently higher life expectancy of women compared to men in all the years and countries examined. This pattern underscores the global phenomenon where women generally outlive men, reflecting differences in biological, social, and possibly lifestyle factors.
In summary, the data illustrates a positive trend in life expectancy for both genders across all five countries from 1900 to 1990. Sweden’s leading position in lifespan highlights its superior health and living standards, while the variations among the other countries reflect differing rates of progress in public health and medical advancements. The enduring higher life expectancy of women compared to men is a key takeaway from the table, emphasizing the need for targeted health interventions to address gender-specific health issues.
Pages Content
Topic sharing
Thanks