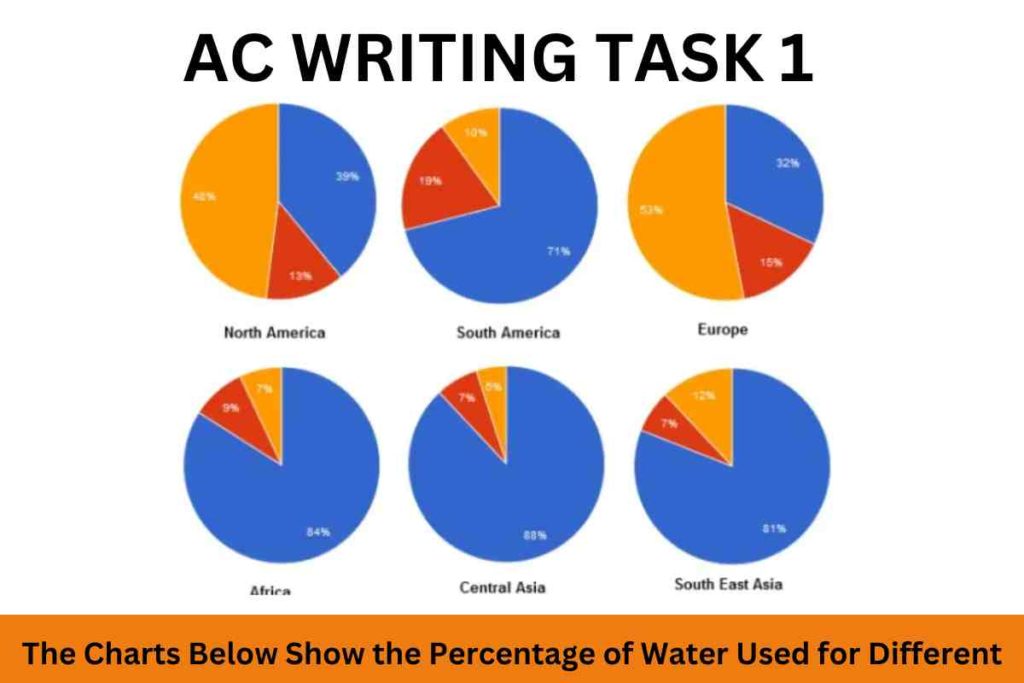
The pie charts depict information about the proportion of water usage for various reasons in six areas of the world, namely, North America, South America, Europe, Africa, Central Asia, and South East Asia.
Overall, it is noticeable that the majority of the countries consume water mostly for agricultural purposes whereas water was used least for domestic reasons in all the six countries.
In Central Asia and Africa, water had the highest percentage usage in agriculture, it accounted for 88% and 84%, respectively, while in North America and Europe, a minority of people consume water for farming reasons. It was 38% in North America and 34% in Europe. In addition, just over half the number of people consumed water for industrial reasons in Europe, represented 54%, while nearly half the number of people made use of water for industrial reasons in North America, it accounted for 48%. Meanwhile, South East Asia, Africa, and Central Asia used less water for industrial purposes; the percentage was 12%,7%, and 5%, respectively.
In contrast, people used less water for domestic reasons in all six countries. In South America, the proportion was 19%, followed by Europe, which had 15%. Central Asia and South East Asia had the least percentage, which was 7% respectively.
Sample 2:-The Charts Below Show the Percentage of Water Used for Different
The given six pie charts illustrate how much water is used in three different areas (domestic, agricultural, and industrial) in six different countries (North America, South America, Europe, Africa, Central Asia, and Southeast Asia).
Overall, the pie charts reveal that six out of four countries( South America, Africa, Central Asia, and Southeast Asia) use the most water in the agriculture sector, while the other two countries( North America and Europe) use it in the industrial sector.
At first, North America and Europe used approximately half of the water supply in the industrial sector, while the other two sectors, agriculture and domestic, only got 39% and 13% for North America and 32% and 15% for Europe. A larger portion of water goes to the agriculture division in Asia, Africa, and North American countries, which is over eight-tenths of their total consumption. The highest consumption of water in all countries is in Central Asia, where 88% of their water is used for agriculture.
Household use of water in South America, Africa, and Asia is 19%, 9%, and 14%, respectively. As for industrial use, it is low compared to the other 10%, 7%, and 17%.

