


The Charts Below Show the Results of a Survey of Adult Education.
The First Chart Shows the Reasons Why Adults Decide to Study.
Write a Report for a University Lecturer, Describing the Information Shown Below.

introduction:
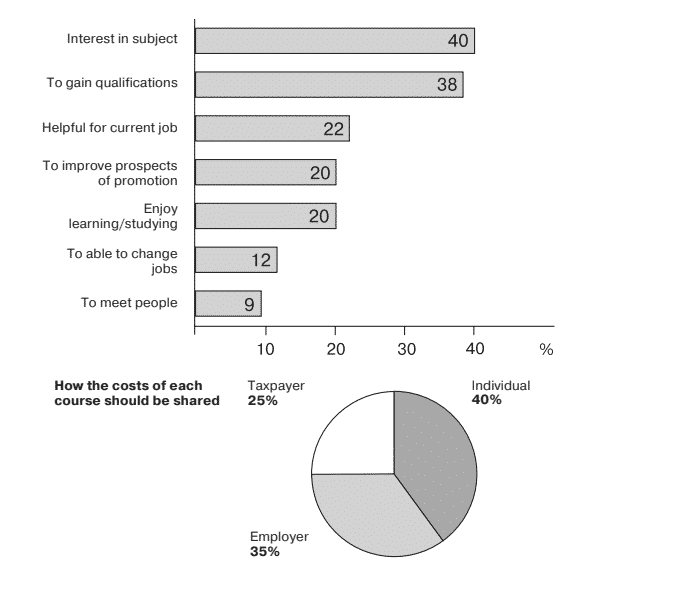
The bar graph and the pie chart elucidate the outcome of research done on adult education. The former graph depicts the reasons related to the decisions taken by youngsters to receive an education. At the same time, the latter graph shows how the costs of each course should be divided.
paragraph 1:
It is crystal clear from the horizontal bar graph; the maximum percentage of individuals(40%) chose to study because of their interest in the subject. Only 2 percent fewer people than the previous one gave their reason to get the qualification. However, the only 9percentum of denizens decided to receive education to get in contact with people. A similar proportion of masses (20%) decided to learn to improve their prospectus to promote and enjoy the study. The percentage of people who chose to learn to get help for their current work was 22%, and 10% less than this decide to get an education to change their job.
paragraph 2:
Proceeding towards the pie chart, people thought that the maximum percentage of costs(40%) should be divided among individuals. While taxpayers should be given the least share of cost percent that was 25%and 35 % of price should be shared with employers.
conclusion:
All in all, the maximum proportion of masses chose to learn because of their interest in the subject, and the maximum percentage of cost share should be given to denizens.
This is the end of the cue card. The Charts Below Show the Results of a Survey of Adult Education. The First Chart Shows the Reasons Why Adults Decide to Study. The Pie Chart Shows How People Think the Costs of Adult Education Should Be Shared. Write a Report for a University Lecturer, Describing the Information Shown Below.
Pages Content