


The diagram below shows how the Australian Bureau of Meteorology collects up-to-the-minute weather information to produce reliable forecasts. Summarise the information by selecting and reporting the main features and make comparisons where relevant.


SAMPLE ANSWER 1:-The Diagram Below Shows how The Australian Bureau of Meteorology
As from the upper diagram represtation, providing us a clear information about Australian bureau of meteorology. Australia get his recent development in sector. This diagram shows all his main works.
Overall, their are many activities in meteorology such as recorded, radio, satelliete and broadcasting. These all profiles operated by a singal body from computer all all these are a very important for all Australian .
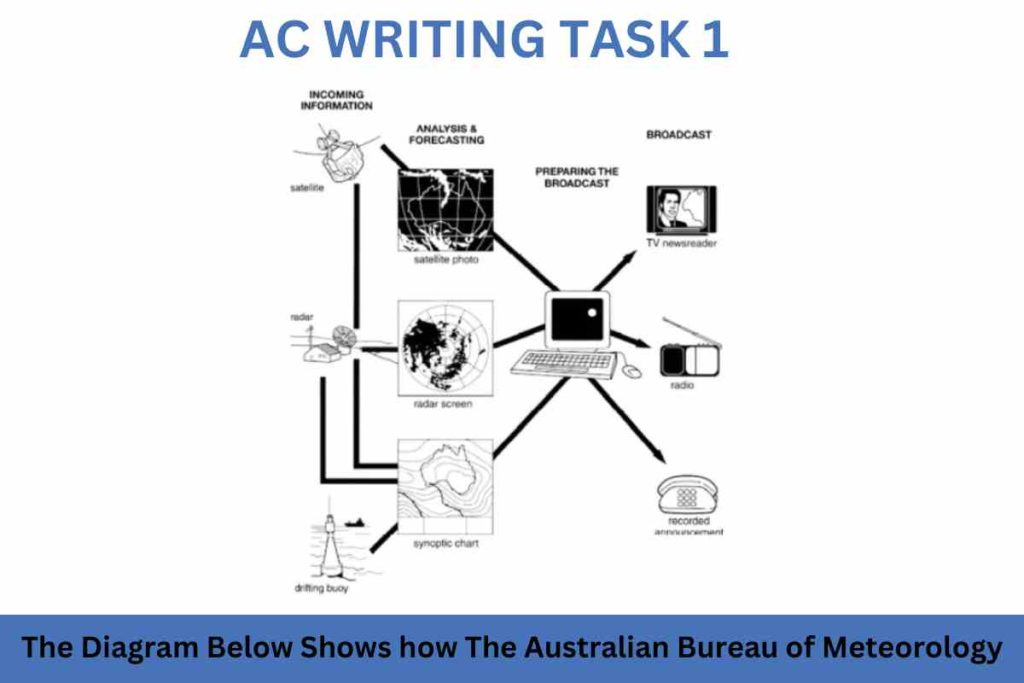
To begin with, the Australian Bureau of Metrology uses three main pieces of equipment . Very first there is device known as satelliete for gathering data about the weather forcast activities which helps normal people for regular get updated about weather activity. satelliete gave his links directly to bureau and from bureau they telecast it to televisions. Secondly radar and drifting buoys both share land and sea information to radar screen and synoptic chart.
Here whichever data is shared by satellite, radar, and buoy can be readable on both radar screens and synoptic charts except satellite photos. Moreover, after receiving all the data from three resources, it is transferred to a computer system, which is used to prepare the broadcast data.
After that, it is shared with all broadcasting platforms. Now people can get weather forecast information from these sources like TV newsreaders, radio, and recorded announcement phone lines.
![]()
