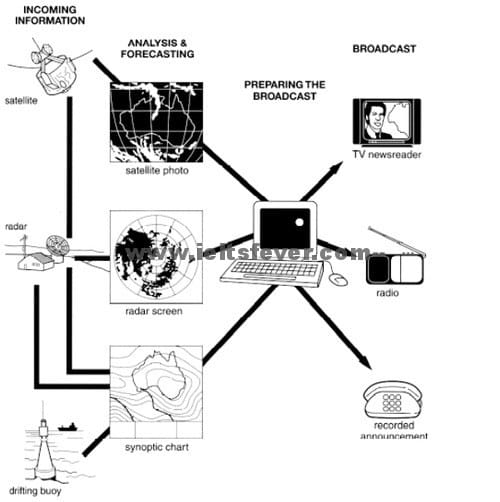
The diagram below shows how the Australian Bureau of Meteorology collects up-to-the-minute information on the weather in order to produce reliable forecasts.
Summarize the information by selecting and reporting the main features and make comparisons where relevant.
You should write at least 150 words.
sample answer Of(The diagram below shows how the Australian Bureau of Meteorology) :
INTRODUCTION:
The diagram gives information about the Australian Bureau of Meteorology which gets information regarding weather in order to demonstrate reliable forecasts.
CONCLUSION:
Overall, the process involves four main steps in order to predict reliable forecasts, which include incoming information, analysis and forecasting, preparing the broadcast, and broadcasting.
PARAGRAPH :
It can be clearly seen from the graph that, there are three sources of incoming information. Firstly through satellite, Australian Bureau collects weather information after that information is analyzed and forecasts through the satellite photo Then after the computer is used to prepare the broadcast and then after the information is telecast through TV newsreader, radio, and recorded announcements. The second method of collecting weather details is through radar, in which a radar screen and synoptic chart can be used for analysis and forecasting, and then after the broadcast is telecast through television, radio, and recorder.
PARAGRAPH 2:
The last and final stage to collect weather up-to-minute information is drafting Buoy. synoptic chart Can be used to analyze and forecasts the information which is collected through drafting buoy and after preparing broadcast the data is forecast through television, radio, and recorder.
sample answer 2:
INTRODUCTION:
The given infographic representation, in the form of process chart, highlights the study of weather forecast by the Australian Bureau of Metrology.
PARAGRAPH 1:
At first, information is sent by satellite . then, it goes to radar where they interpret the information into synoptic charts. Subsequently, it shows on the radar screen and have detailed satellite images and them analysis information which is given to them. Afterward, they make predictions regarding the information.
PARAGRAPH 2:
Finally, the information is ready to be broadcast by a huge computer server. Lastly, it broadcast by various methods such as the tv channels, radio and recorded announcements by government and it reaches to people of Australia.
CONCLUSION:
Overall, it is a lengthy process to make a forecast about the weather and it has several steps. However, make predictions and gather information via satellite and radar these are the two crucial part of the weather prediction.
This is the end of ACADEMIC writing task 1 (The diagram below shows how the Australian Bureau of Meteorology collects up-to-the-minute information on the weather in order to produce reliable forecasts.)
Pages Content
The diagram illustrates the process of collecting up-to-date data about weather condition
in order for valid forecast demonstration by the Australian Bureau of Meteorology.
Overall, there are three stages in the production of forecast. Meanwhile, the information goes through three factors such as satellite, radar and drifting buoy.
In the first stage, received information is analysed and forecasted by the satelllite photo, radar screen and synoptic chart. Satellite information is tested via all three categories. Radar collected details are reviewed with the help of radar screen and synoptic chart. Only in drifting buoy method of incoming data it is used one method of analysing . Then, predicted facts are sent to the preparation together.
Finally, collected materials are ready to broadcast in three procedure: TV newsreader, radio and recorded announcement by phone
Writing,Reading,
Its too tuff difficult subject
The picture illustrates the stages to collect data on weather to have prestigious weather forecasts of Australian Bureau of Meteorology.
It is clear that the whole process has 4 separate stages from collecting and analyzing data to preparing forecast content and publishing them to the media.
In the first step, incoming information will be captured by satellites, radar stations or drifting buoys. In the next step, the collected data will be analyzed and forecasted to create visuals. There are three types of visuals: photos generated by satellite, screens produced from the information of radar and satellite, and synoptic charts created by all sources of data.
In the third step, all results from the analysis and forecasting step will be processed by computers. This step is called “preparing the broadcast”. After having the final broadcast content, the reliable weather forecasts will be published to the most popular broadcast channels such as TV newsreader, radio or recorded announcement.
The given data illustrated about the weather forecast in the Australia Bureau of Meteorology, is given by pictures diagram with different steps, divided into three parts: Information receiving part, analyzing part where to prepare the report, and broadcasting part, collected up-to-minutes.
According to the picture diagram, it is clear that all information is collected by satellite photos and transferred to the radar system where this data is consisted on three major parts: satellite photos, radar screen, and synoptic chart that is get by drifting buoy.
On the other hand, the data provided indicates that all these collections is transferred to the computer system where working team prepare the broadcasting report and send it to the T.V newspaper who explains to the public with the help of different pics and diagrams according to upcoming variation in weather, radio where the public do not have the T.V approach, to get the information, and telephone recording where the public is not present at the time and would get all information after coming back from their work positions.
In summary, with the help of all these devices and collected information data, every country of the world would try to give the upcoming variation in the weather for saving them from any natural hazards.