The graph below shows the average salaries earned by people with different levels of education. Summarise the information by selecting and reporting the main features, and make comparisons where relevant.
Sample Answer The graph below shows the average salaries earned by people with different levels of education.
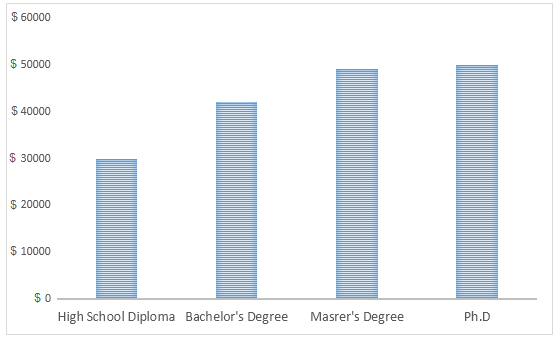
The given bar chart depicts the average remuneration received by the students who belong to the variant hierarchy of education.
Overall, the PhD candidates earn the highest salary, whereas the lowest salary rewards belong to students studying for a high-school diploma.
The PhD students receive approximately fifty thousand dollars as an average income. However, the second most earning educational group is postgraduate students. They earn almost equal remuneration as PhD students.
The bachelor degree students stand the third position for receiving the highest payment earning about forty thousand dollars. In comparison, the average salary of high school diploma students is less than a thousand dollars of the wages of undergraduates students. Thus high school diploma belongs to the most miniature salary receivers than among three.
Follow Us on IELTSFever Instagram for more updates and the latest test tasks.
Also, read the Article Pie Charts Compare the Expenditure of a School in the Uk.