The Graph Shows Information on Smoking Frequently Seen Among Parkview Secondary School Athletes. Summarise the Information by Selecting and Reporting the Main Features and Making Comparisons Where Relevant. You Should Write at Least 150 Words.
 Sample Answer 1: The Graph Shows Information on Smoking Frequently Seen Among Parkview Secondary School Athletes
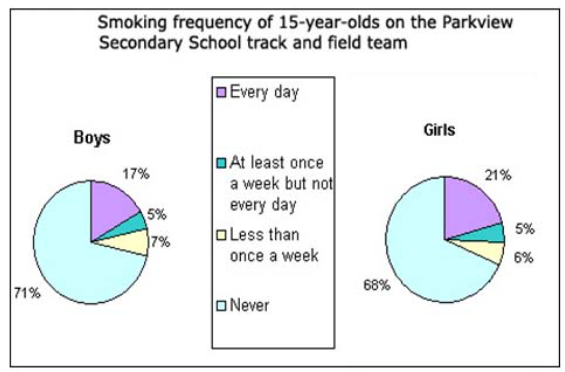
The pie chart depicts the percentage of male and female athletes aged 15 who smoke every day, at least once a week, but not every day, less than once a week, and those who do not smoke at all at Parkview Secondary School.
Overall, the chart clearly shows that the majority of the Parkview track and field team does not smoke. The lowest percentage of smokers came from students who smoke less than once a week.
According to the data, the category of non-smokers is the highest, with 71% and 68% of male and female athletes, respectively. The second-ranked group is that of athletes who smoke daily, with ladies comprising 21% and men 17%.
The third group of athletes smoke less than once a week, with 7% of the boys and 6% of the girls falling in this category. Lastly, 5% of both genders are observed to smoke at least once a week but not every day.
Sample Answer 2: The Graph Shows Information on Smoking Frequently Seen Among Parkview Secondary School Athletes
The two pie charts compare the data between Male and female athletes at Parkview Secondary School about frequent smoking.
Overall, although it is clear from the graph that a considerable number of sportspersons have never tasted smoke in their lives, only a few of them do it every day.
There is a dramatic population of boys and girls with no history of smoking in their entire school life at 71 %, slightly less than three-quarters, respectively, and 68 %, significantly more than half, respectively.
Despite that, there is a small proportion of boys who conduct smoking behaviour every day at 17%, while girls overlead boys by 4 %, just under a quarter.
Pages Content
Discover more from IELTS Fever
Subscribe to get the latest posts sent to your email.