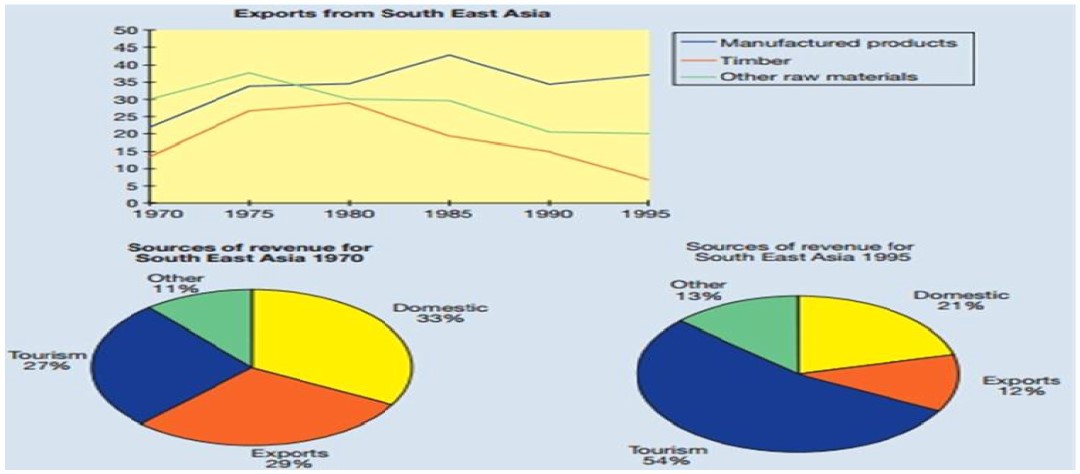
 The diagram below illustrates a graph of international trade from Southeast Asia and pie charts depicting four sources of revenue from 1970 to 1995.
Overall, the demand for exporting all three products was high in 1970 except for manufactured goods; in 1995, all products except processed items declined. The highest sources of revenue generated in 1970 and 1995 were domestic and tourism, respectively. In contrast, other miscellaneous items and exports were the least in demand in the years 1970 and 1995, respectively.
In 1970, the export of timbers was almost at 14, then increased to 25; it remained constant till 1980, then plummeted the following years and was at its lowest in 1995. Also, the same applied to raw materials, starting at 30 then peaking at almost 40 in the year 1975 then decreasing to 20 in 1990 then remaining constant in the next five years. Whereas, processed items had a low demand of approximately 23, peaked at 40 in 1985 then after 10 years it dropped to 35.
In the year 1995 the largest section for the source of revenue was tourism (54%), followed by domestic (21%), other miscellaneous and exports shared the lesser fraction 13% and 12% respectively. In 1970 the 3 major sources were domestic, exports and tourism while miscellaneous accounted for 11%.
Follow Us On IELTSFever Facebook Page For More Updates
Discover more from IELTS Fever
Subscribe to get the latest posts sent to your email.