The graphs show changes in the spending habits of people in the UK between 1971 and 2001. Write a report to a university lecturer describing the data. Write at least 150 words
Sample answer of The Graphs Show Changes in the Spending Habits of People in the Uk Between 1971 and 2001
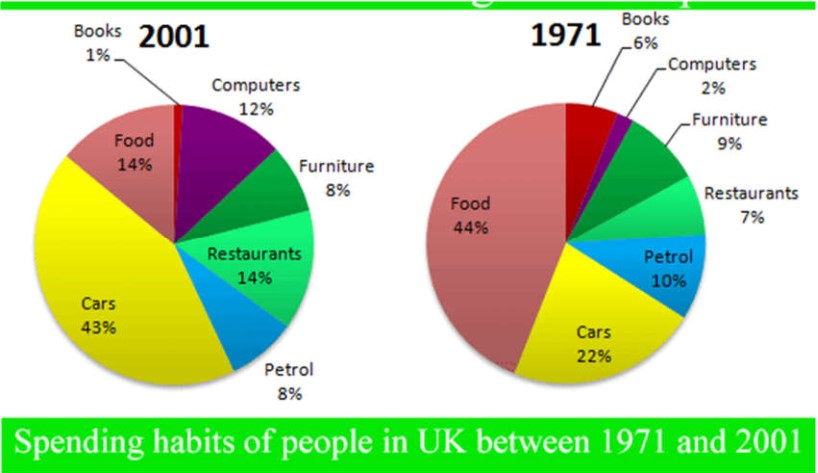
The given pie charts depict the information about the expenditure of people on their habits in the UK from 1971 to 2001.
Having a quick glance over the chart, it is sawing that the maximum amount spent on food and cars was 44% and 22% and the minimum was expenditure on computers (2%).In 1971, surprisingly after 30 years, the highest expenditure was on same habits by people and the figure was 14% and 43% but least expenditure was on the book, only 1%. People spend 7% on the restaurant, and the proportion gets double after three decades.
Moving towards the rest of the description, it is seen that the percentage of expenditure on petrol was just below the one-tenth in both years that was 10% and 8% respectively. The spending on furniture was almost similar, in the former year, the per centum of spending was 9%, and it was inclined by merely 1% in a later year. In 1971, 6% of expenditure was done by people on books; however, people spent 12% on the computer in 2001. Thus, the interest of people towards books and restaurants as a leisure activity was decline.