The Line Graph Below Shows the Consumption of 3 Different Types of Fast Food in Britain from 1970 to 1990. Summarise the Information by Selecting and Reporting the Main Features, and Make Comparisons Where Relevant.
 Sample Answer: The Line Graph Below Shows the Consumption of 3 Different Types of Fast Food
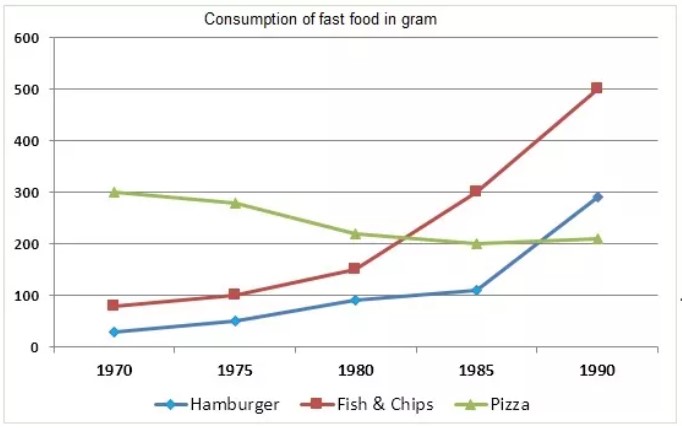
The line graph describes the usage of three separate forms of fast food, such as hamburgers, pizza, and fish and chips, in England between 1970 and 1990.
Overall, over the whole period of time, there was an increase in hamburgers, chips, and fish. However, there was a steady decline in pizza production, which remained unchanged.
Pizza was a popular fast food around Britain in the first decade, followed by a moderate fall from 1975 to 1980, and ultimately levelling out at 200 grams throughout the time period.
There was a slight rise in fish and chips from 1970 to 1980, at a little less than 150 grams. Surprisingly, within a short period of time, a sharply elevated level was noted at 500 grams exactly after 1980 onwards.
Suddenly, hamburgers have been just below 300 grams since late 1985. Regardless, it was a slow improvement from 1970 until early 1985, when it was just under 50 grams and negligible above 100 grams consecutively.
Follow us on the IELTSFever Facebook Page for more updates
Discover more from IELTS Fever
Subscribe to get the latest posts sent to your email.