The line graph shows Paris Metro station passengers. Summarise the information by selecting and report in the main features, and make comparisons where relevant. Write at least 150 words.
Sample Answer of The Line Graph Shows Paris Metro Station Passengers
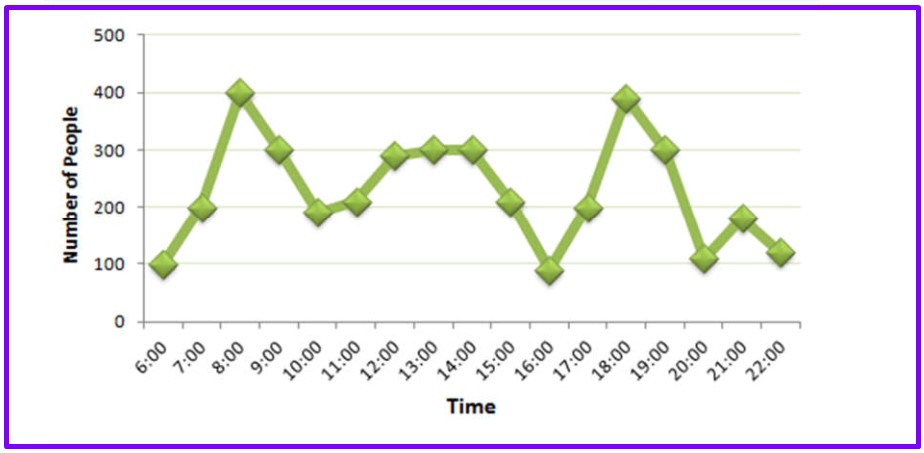
The given line charts illustrate the passenger’s number in the Paris metro station between 6 o’clock to 22:00.
Overall, the citizen number is the peak on morning hours and in night hours additionally, late-night and evening time it is on the least.
At 6 in the morning time 100 passengers which number rises rapidly and after 2 and half hour it is 400 people. The number of people is dropping and 200 passengers on the station at 10 o’clock. Furthermore, between 12 to 14 has the same number of passengers on account of 300 which decline till 17 o’clock where it touches it dip, and it is 90 people.
2 hours later, the traveller number is the same as 8 o’clock time has, and it decreases 100 passengers in one hour and continues to plunge till 20:30 o’clock, the number is same as early morning 6 o’clock has and same as 22 o’clock, between couple hours it has 180 people.
Follow Us IELTSFever Instagram for more updates
Also, Read Number of Houses Built Per Year in Two Cities Derby and Nottingham