


The Number of Foreign Tourists Visiting X Country in 2019 and 2020. Summarise the information by selecting and reporting the main features and make comparisons where relevant.
Sample Answer: The Number of Foreign Tourists Visiting X Country in 2019 and 2020
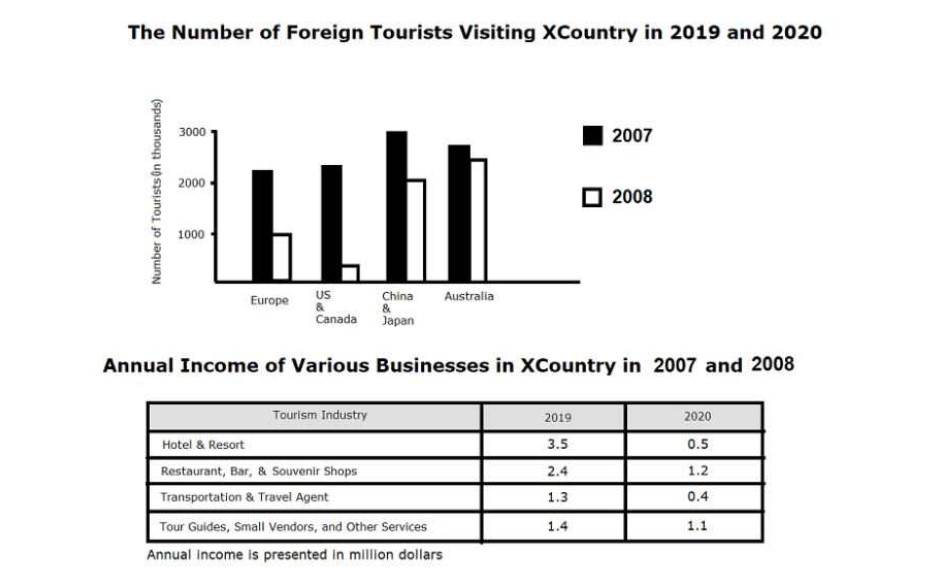
he bar graph represents the figure of international visitors who visited different countries in the years 2019 and 2020, whereas the table reveals the data about the net worth of different types of employers per annum in the same countries during the entire period. 📊 The scale for the graph and the table is presented in thousands and million dollars, respectively.
Overall, it can be observed that the highest number of visitors traveled internationally in the initial year (2019). 🌏 Additionally, the annual income for all business sectors decreased in the subsequent year (2020). 📉
To commence with, the number of tourists who visited Europe in 2019 was almost similar to the number visiting the US and Canada. 🇪🇺🇺🇸🇨🇦 However, in the following year, the count of visitors to the US and Canada was lower than that of Europe, where approximately 1,000 people visited. Moreover, there were 3,000 and 2,000 individuals who traveled to China and Japan in 2019 and 2020, respectively. 🇨🇳🇯🇵 In Australia, the number of visitors for both years remained between 2,000 and 3,000. 🇦🇺
On the other hand, the annual income of hotels and resorts was seven times higher in 2019 compared to 2020. 🏨💰 The yearly earnings of restaurants, bars, and souvenir shops declined from 2.4 million dollars to 1.2 million dollars. 🍽️🍹🛍️ The tourism business had almost the same revenue as other services in 2019, whereas in 2020, a significant difference occurred with tourism earning 0.4 million dollars and other services earning 1.1 million dollars. 💼💵
Follow Us on The IELTSFever Facebook Page for more updates