


The pie chart shows the amount of money that a children’s charity located in the USA spent and received in one year, 2016. Summarize the information by selecting and reporting the main features and make comparisons where relevant.
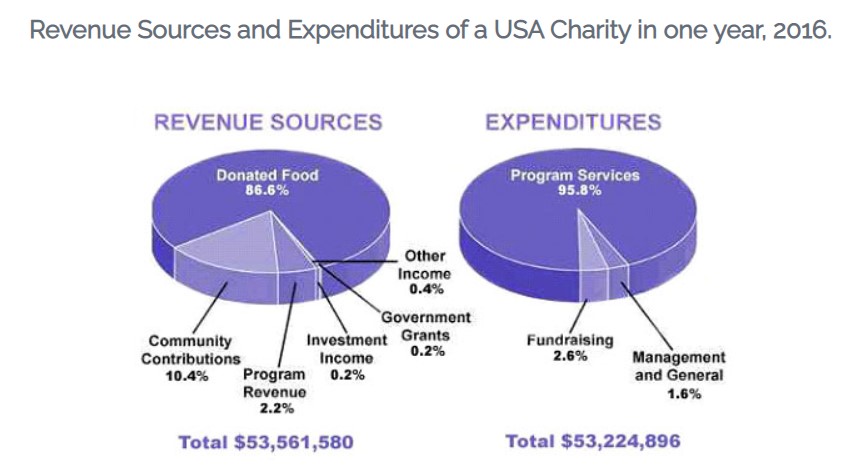

The yielded two pie charts demonstrate the percentage of revenue and expenditure of a children’s charity in the USA.
Overall, it can be clearly seen that the majority of money spent on food wile owing to program service they gained. Additionally, authorities of charity or management spend more money than received.’
For receiving, charity gain $53,224,896 amount of money and among roughly 96% of the money received by various program whereas with the least percentage, management and general contributed only 1.6%. moreover, fundraising aid only 2.6% to gaining fund.’
For spending, a quarter proportion of fund used for communication contribution which was second highest percentage. Among spent $53,561,580, 86.6% of the money was spent on donating food to those who require it. Moreover, government grants and investments spend the same percentage of money on account of 0.2%. 2.2% used for program revenue whereas double percentage than government grant was on other sectors.
Follow Us on IELTSFever Instagram for more updates and the latest test tasks.
Also, Read The Bar Chart Below Gives Information About Five Countries