


The pie chart shows the percentage of women in poverty and the bar chart shows poverty rates by sex and age. They are from the United States in 2008.

Write at least 150 words
Sample Answer
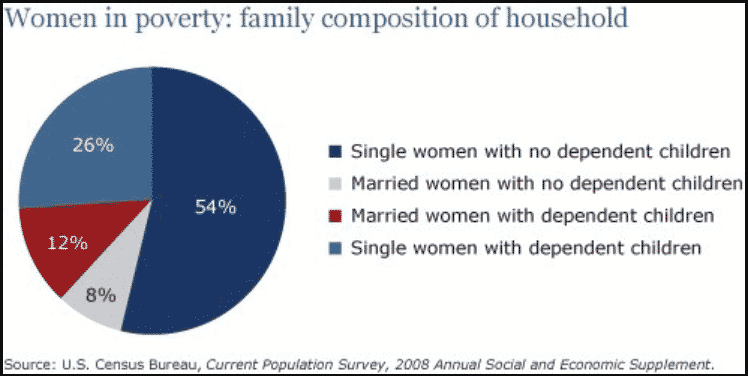
The pie chart compares the percentages of women in poverty according to their marital-status and dependent children, based on a census taken in the US in 2008. In addition, the bar graph depicts poverty rates based on gender and age groups, from the same source.
Surprisingly, a little over half of the women in poverty were single and had no dependent children, while a quarter were single women with dependent children. Married women, with or without dependent children, were at just around 10% each.
Through the bar graph, it is evident that women were poorer than men considering any age group. A concerning figure was that the poorest among all age groups were toddlers aged 5 years or below.
Overall, poverty significantly affected women aged less than 34 years. The over 35s had a lesser impact and figures stood at around 12%. Among those aged 75-or-above, the number of women suffering from poverty was double than of men.
So this is the sample answer of (The pie chart shows the percentage of women in poverty and the bar chart shows poverty rates by sex and age. They are from the United States in 2008.)