


The Two Pie Charts Below Show the Online Shopping Sales for Retail Sectors in Canada in 2005 and 2010. Summarize the Information by Selecting and Reporting the Main Features, and Make Comparisons Where Relevant.
Overall, it can be observed that while Electronics & Appliances remained the leading sector in 2005, its share declined by 2010, giving way to a notable increase in Food & Beverage sales. Meanwhile, Home Furnishings experienced a sharp fall, whereas Video Games showed a steady rise in popularity over the same period.
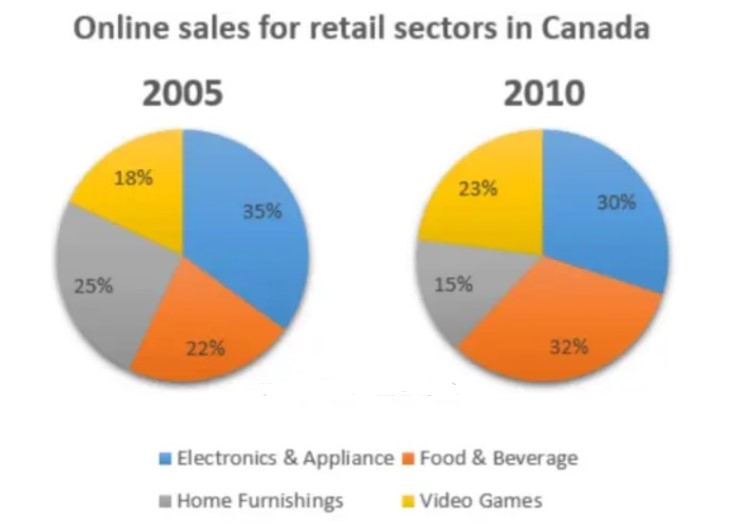
In 2005, the largest share of online retail sales came from Electronics & Appliances, which accounted for 35% of total sales. This was followed by Home Furnishings at 25%, while Food & Beverage and Video Games held smaller proportions, at 22% and 18% respectively.
By 2010, the landscape had changed significantly. Food & Beverage saw the greatest growth, rising from 22% to 32%, making it the largest segment. In contrast, Electronics & Appliances fell by 5 percentage points, down to 30%, though it still represented a substantial share. The most dramatic decline was in Home Furnishings, which dropped from 25% to just 15%, indicating a reduced consumer interest in this sector. On the other hand, Video Games rose steadily, increasing from 18% to 23%, overtaking home furnishings by 2010.
In summary, over the five-year period, Food & Beverage and Video Games gained greater popularity in Canadian online sales, whereas Electronics & Appliances and particularly Home Furnishings lost their earlier dominance.
Follow Us on The IELTSFever Facebook Page for more updates