


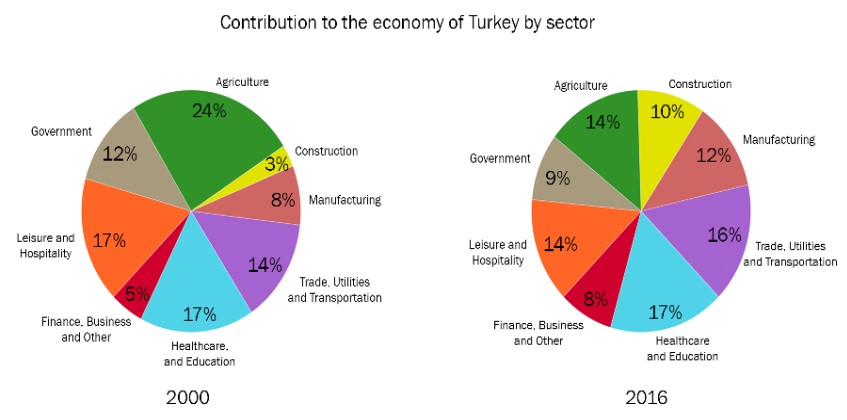

Overall, in the beginning, the construction sector’s contribution was the lowest, and the contribution of agriculture was the highest. In comparison, in the end, healthcare and education became the highest segments of Turkey’s economy, and finance, business, and others were the lowest contributing segments of the economy.
Construction contributed only 3% to the economy in 2000, but it became three times higher in 2016. Trade, utilities, and transportation increased only 2% in 2016 compared to 2000. In 2000, manufacturing and finance, business, and other services contributed 8 % and 5% to Turkey’s economy, respectively, which rose to 12% and 8% in 2016.
Agriculture contributed a large amount, almost one-fourth of Turkey’s economy in 2000, which drastically decreased to 14% in 2016. The contribution of the government, leisure, and hospitality sectors was 12% and 17%, respectively, and decreased by 3% in 2016. In addition, the contribution of the healthcare and education sectors remained constant in both years at 17%.
Follow Us On IELTSFever Facebook Page For More Updates