Write a report on the Consumption of Fast Food in the UK for a university lecturer describing the information in the graph. Summarize the information by selecting and reporting the main features, and make comparisons where relevant.
The line graph compares the usage of three eatables between 1970 and 1990.
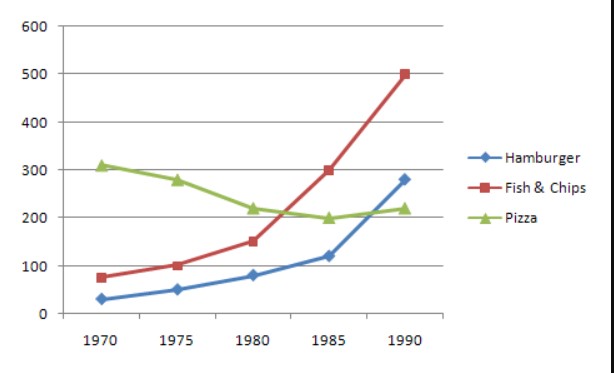
Overall, the three food items experienced different trends in the time period. While the consumption of fish and chips rose along with hamburgers, the quantity of Pizza fell over time.
As the graph depicts, hamburger figure started at 20% in 1970 followed by a slight increase to just over 100% by 1985. Then, it witnessed a boost in consumption and reached just under 300%. Regarding pizza, in 1970, the usage stood at roughly three hundred per cent, which is the highest number among all of them. Afterwards, the percentage plunged to 200% in 1985, subsequently rose to just over two hundred per cent.
By contrast, the consumption of fish experienced an increase in the five years. In 1978, it consumed nearly 100% followed by rose to few points and reached exactly 100%. Then, the usage witnessed s sharp growth to 150%, 300%, and reached 500 per cent, the highest number in 1980, 1985, and 1990, respectively.
Follow Us on IELTSFever Instagram for more updates and the latest test tasks.
Also, Read The Pie Chart Below Shows Energy Is Used in a Typical Australian