


Compare a Map of a City in 1950 and Now. Summarise the information by selecting and reporting the main features and make comparisons where relevant.
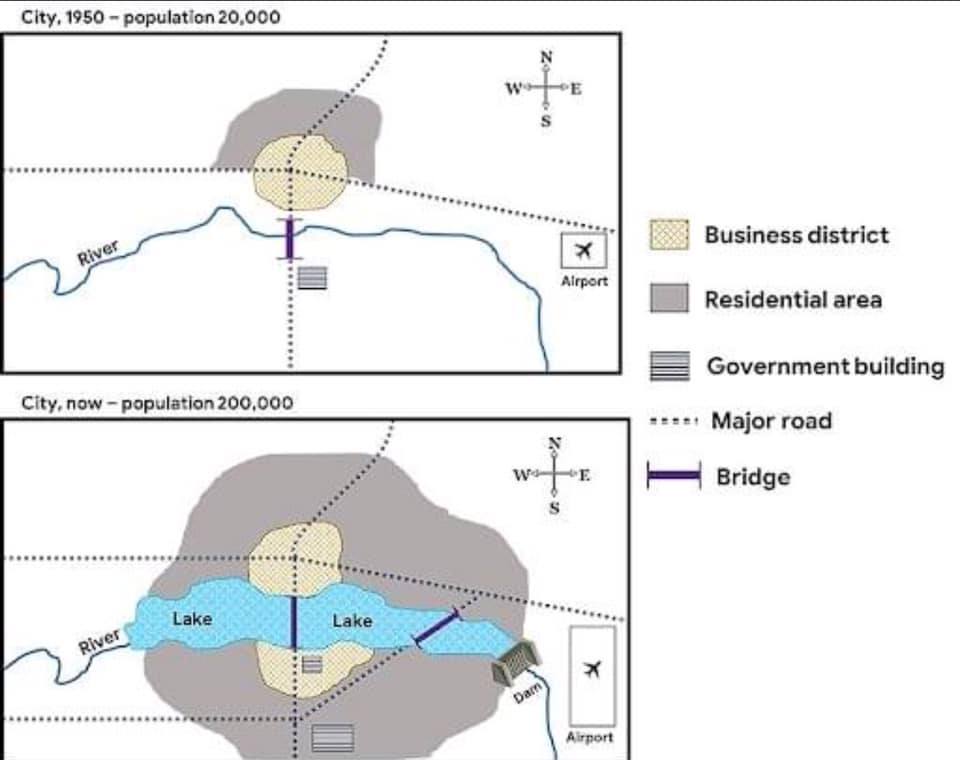
The two diagrams illustrate the different features in a given city between the year 1950 with 20,000 resident and cutrent time with 200,000 resident.
At the begining the city were not only considerable small in population as it consisted fewer residents but also had limited trading opportunities due to little bussines area compared to later years where by residents and businesses rise massively.
The city appearance in 1959 was dramatically empty as the residential area and business district were significant little with total of 20,000 residents, therefore the city had one goverment building located downside the river nearby the only city’s brigde that connnect two parts of the city where separated by the river at the center of the city according to compass direction from the given map.
However nowadays the city has changed a lot compared to 1950, as the population size elevated in very large quantity of 200,000 and not to forget the first goverment building surrounded by the new business district in southern part of the city alongside the lake that substituted the river. Also, another government building is located in the southern part of the city, which makes two government buildings in total.