


The Map of a City in 1950 and now. Summarise the information by selecting and reporting the main features, and make comparisons where relevant.
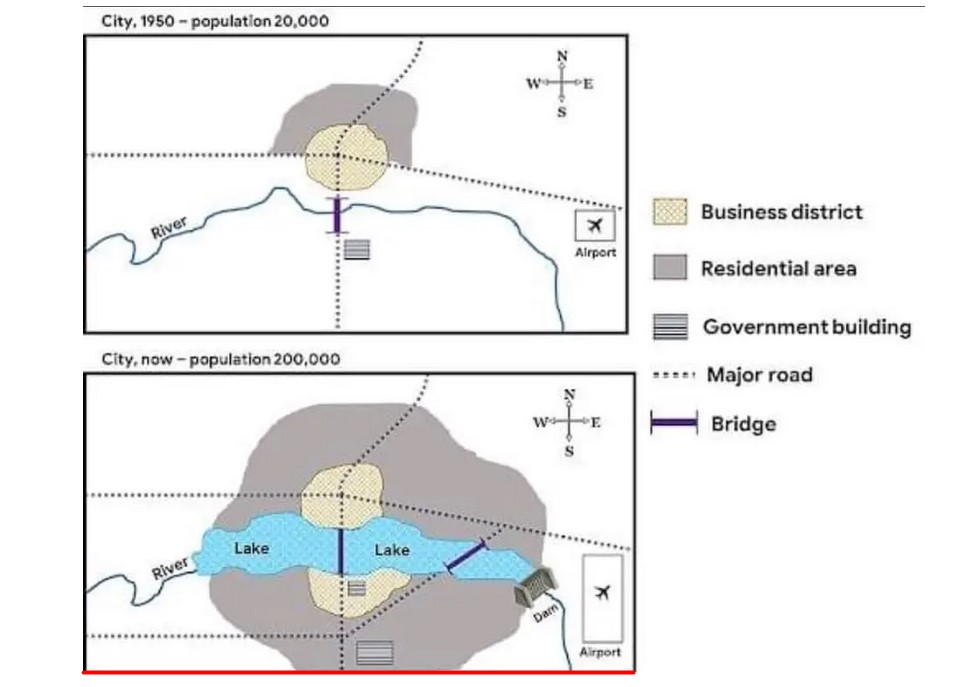

There are two maps available for a city for two different years, such as for 1950 and for now. It illustrates the difference between what was before and now in five criteria such as business district, residential area, government building, major road and bridge.
In 1950, the city population was 20,000 while it is 200,000 now, which is ten times than 1950. With the increase of population, other constructions are also expanding than before. We can easily identify that in 1950 the only north side of the river had a business district and residential area available, and only one government building was there in Southside.
At the current time, the river water is conserved by manufacturing a dam on the east side and making a lake to utilize the water. Both north and south side business districts and residential areas are available now. Now there are two main roads to connect the north and south regions and two government buildings in the south zone while in 1950 both were only one for each.
The business district becomes a central part of the city, and residential areas cover it from all sides. The airport area also expands almost 3 times than before to handle the rise of the population. Now south zone also has the road from the west to the central zone.
In conclusion, there has been a major change in the last five decades and high increases of a residential area.
Follow Us on IELTSFever Twitter for more updates
Also read: The Maps Below Show Pebbleton 20 Years Ago and Today