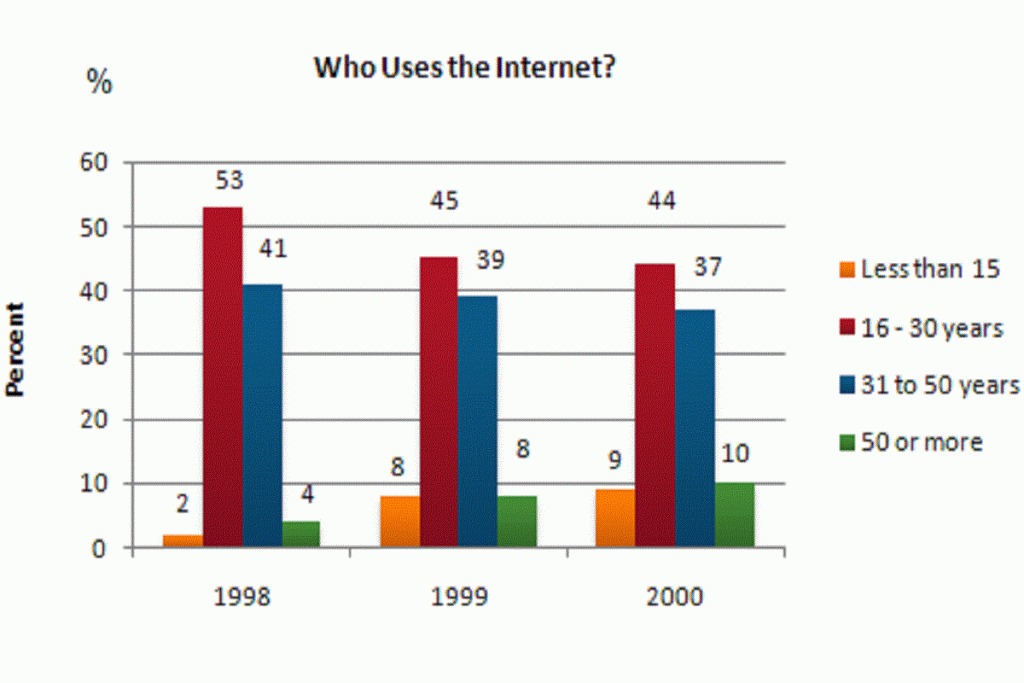
the graph shows internet usage in taiwan by age group

The Graph Shows Internet Usage in Taiwan by Age Group, 1998-2000.

The Graph Shows Internet Usage in Taiwan by Age Group, 1998-2000. (1)

The graph shows Internet Usage in Taiwan by Age Group, 1998-2000. Summarise the information by selecting and reporting the main features, and make comparisons where relevant. This given bar graph illustrates the information about the utilization of the internet by different groups of age between the time period 1998 and 2000 in the country Taiwan […]

The Graph Shows Internet Usage in Taiwan by Age Group, 1998-2000. Read More »

The graph shows internet usage in Taiwan by age group, 1998-2000.

The graph shows internet usage in Taiwan by age group, 1998-2000.   The given vertical bar graph depicts the information about the proportion of using the internet in Taiwan by four different age group in the given years 1998 to2000. To elaborate, the highest percentage of the custom of the internet was at 53%, 45%

The graph shows internet usage in Taiwan by age group, 1998-2000. Read More »

Scroll to Top