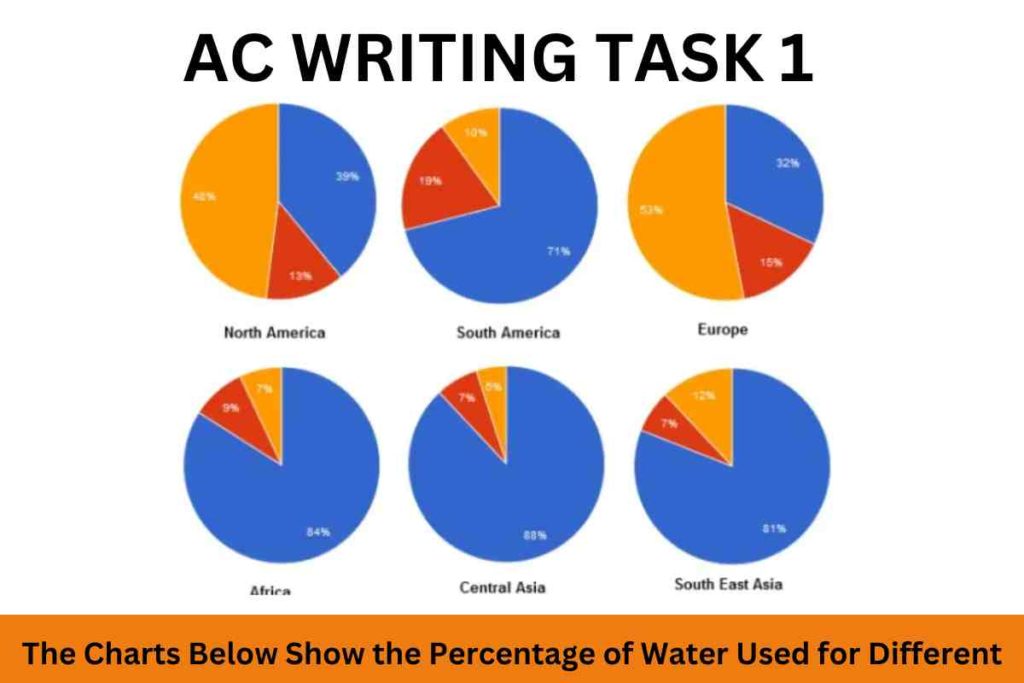
The Charts Below Show the Percentage of Water Used for Different
The charts below show the percentage of water used for different purposes in six areas of the world. Summarise the information by selecting and reporting the main features, and make comparisons where relevant. Sample 1:-The Charts Below Show the Percentage of Water Used for Different The pie charts depict information about the proportion of water […]
The Charts Below Show the Percentage of Water Used for Different Read More »


