
The bar chart gives information about life expectancy in Japan, Korea, the United States, and Indonesia, and the table shows the change in life expectancy between 1953 and 2008.
 Sample 1: The Bar Chart Gives Information About Life Expectancy in Japan: AC Writing Task 1
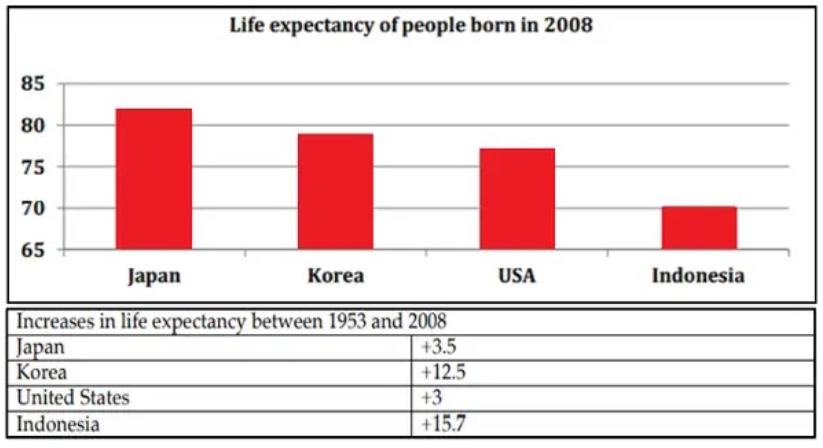
The bar chart compares the life expectancy of people in four countries in 2008, and the table provides information about the life expectancy change between 1958 and 2008 in these four countries.
Overall, the life expectancy was the highest in Japan and lowest in Indonesia. The increase in life expectancy was greater in Indonesia than in other countries.
In 2008, the people of Japan had a much higher life expectancy, close to 82 years, whereas the people of Indonesia had the lowest life expectancy rate of about 70 years. The life expectancy of people in Korea was higher by nearly two years than that of the people in the USA, with approximately 77 years of life expectancy.
Between 1953 and 2008, the life expectancy of people in Indonesia showed a remarkable increase of 15.7 years, while a growth of 12.5 years can be observed in Korea. While the USA saw the lowest rise in life expectancy with three years, it was slightly greater in Japan than in the USA by 0.5 years.
Sample 2: The Bar Chart Gives Information About Life Expectancy in Japan: AC Writing Task 1
The bar graph given illustrates the life expectancy of people born in 2008 in Japan, Korea, the USA, and Indonesia. However, The table demonstrates the changes observed in life expectancy between 1953 and 2008.
The maximum ratio, which was seen in the given bar graph, was in Japan, whereas Indonesia had the lowest rate. The high increase was contrary in Indonesia, where the least shootings happened in the US.
The life expectancy in 2008 in Japan was approximately 82%, dropping to nearly 3% for Korea. Eventually, the proportion again fell to around 2% and reached 72% for the US in the same year. Moreover, Indonesians were at 70% by the end of the data in 2008.
Moving further, the increment marked in the given table was in Japan between the years 1953 and 2008, which rose slightly by 3.5%. Stimulately, the unexpected growth of the birth rate in the Korean state, around 12.5%, was given in the data. However, the United States increased around 3% solely, which depicts the least amount of increase. Meanwhile, Indonesians had an addition of 15.7%, the highest among them by the end.
Discover more from IELTS Fever
Subscribe to get the latest posts sent to your email.


