 Sample 1:-The Bar Chart Illustrates the Percentage of Businesses in Spain

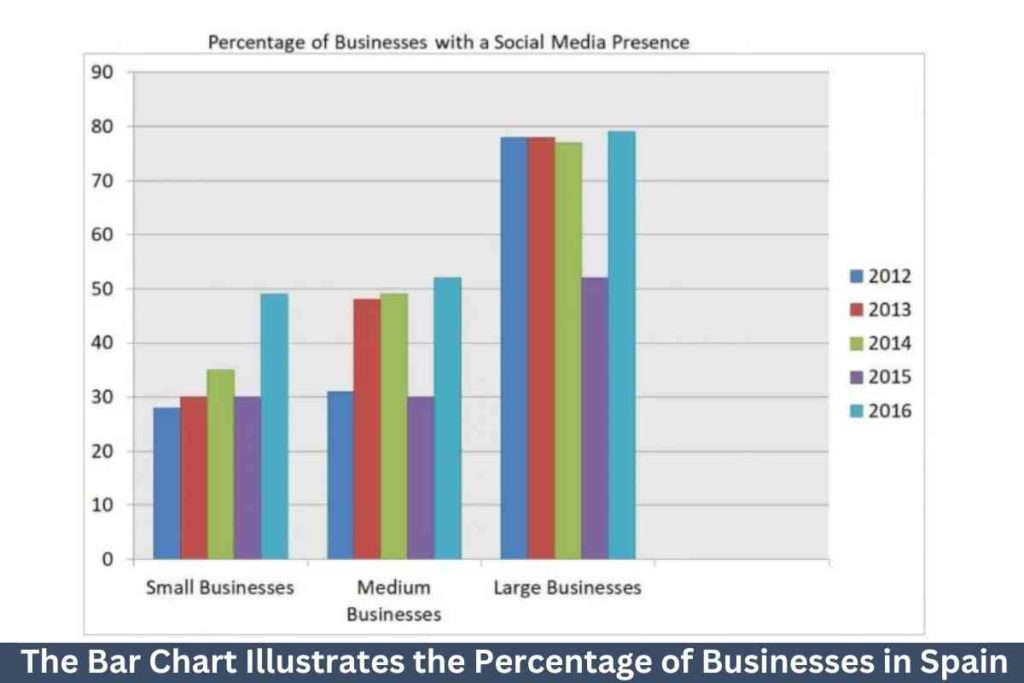
The bar chart shows data on the percentages of all businesses (small, medium, and large) in Spain that had a social media presence between 2012 to 2016.
Overall, the large corporations had the highest use of social media platforms. While the medium and small corporations both shared similar percentages of usage and accounted for a lesser use.
The small and medium firms both experienced the highest percentages in 2016, around half a percent. While in 2015, they were both at 30%. In the years 2013 and 2014, the medium firms almost reached 50% in both years. Compared to the small firms that were at 30% and 35%, respectively. In the year 2012, the small firms experienced the lowest at almost 29%. While the medium firms were at a little above 30%.
Large companies all had the highest percentages of social media usage compared to other companies, which were close to 80% in all years, except in the year 2015, which experienced a little above 50% usage.
![]()
Sample 2:-The Bar Chart Illustrates the Percentage of Businesses in Spain
The bar graph shows the percentages of smaller, medium, and larger businesses’ popularity on social media from 2012 to 2016.
Overall, it can be seen that larger businesses were the most famous business on the Internet while smaller businesses were the least popular business over the periods.
To commence, larger businesses topped in all the years as it, recorded about 88% in 2012 and 2013 as well as 87% in 2014. It then declined to an approximate value of 82% and finally rose drastically to 89% in 2016.
Moreover, Medium businesses were the second most popular business on social media over periods. It accounted for about 31% in 2012, increased to 48% in 2013, 49% in 2014, and decreased to 30% in 2015. It later inclined 52% in 2016. Lastly, smaller businesses were the least business to gain a presence on the Internet over the entire period. It recorded 28%, 30%, 35%, 30%, and 49% in 2012, 2013, 2014, 2015, and 2016 respectively.
Sample 3
The vertical bar chart demonstrates the media of Spain and shows how business proportions facilitate between 2012 to 2016. Overall, it is articulated from the chart that business has three categories. The third was the highest among all.
Comment, in 2012, the percentage of business was nearly one-third. However, in the medium business, it gradually increased by approximately 32%, while in the large business, it unimaginably escalated by approximately 78% respectively. Subsequently, in 2013 and 2014, the scenario of these two years was gradually the same in the proportions of all parts of the businesses that were 30% and nearly 35% in the small business, 48% and 49% in small businesses, 78% and 75% in the large businesses respectively.
Desperately, in 2015, the business ratio was analogous in the small and medium categories, which was exactly 30%. Nonetheless, on a large business scale, it significantly increased by 52% in the year 2015. Oppositely, in the year 2016, the business scenario was highest in all formats of businesses. Similarly in the small business, it was nearly one half, after that in the medium business it was 55% as well as in the large business it was nearly 80%.
Discover more from IELTS Fever
Subscribe to get the latest posts sent to your email.


