


The Bar Chart Shows a Family’s Monthly Spending in Dollars in the USA on Three Items in 2010. Summaries the Information by Selecting and Reporting the Main Features and Make Comparisons Where Relevant.
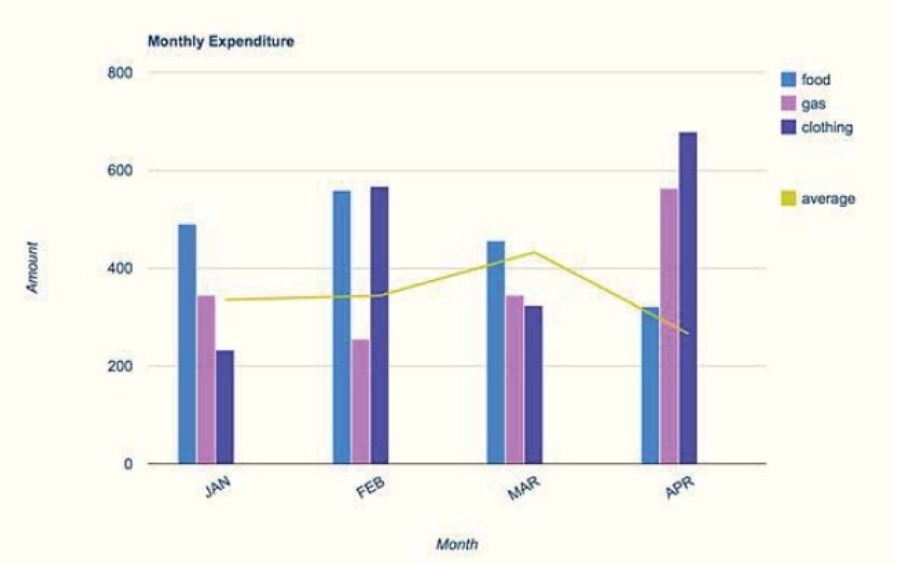

The bar graph illustrates the expenditure on basic necessities by a family in the USA from January to April 2010. The scale is in dollars.
Overall, it is clear from the graph illustration that the average rate of expenditure was the highest in March 2010. Moreover, the most significant amount of money was spent on clothing in the last month than on any other item.
To start with, around $ 500 was used to buy food in January, which was higher than the money spent on gas and outfits. In the next month, almost the same amount of cash was spent on sustenance as on shopping for attire. However, the family used gas for approximately 250 dollars.
Additionally, the expenditure rate for food and clothing decreased compared to the previous month, while the expenditure on gas increased. Apart from this, more than $300,000 and $ 600 were paid for food, gas, and clothes in April, respectively. Furthermore, the average gradually increased over the first three months, reaching its peak in March and then declining later.
Follow us IELTSFever Facebook Page for more updates