


The bar chart shows the typical weekday for students in three different countries. Summarise the information by selecting and reporting the main features and make comparisons where relevant.


The bar charts illustrate the data for weekdays and how the students are utilizing it in three different countries like, the UK, Japan, and Germany.
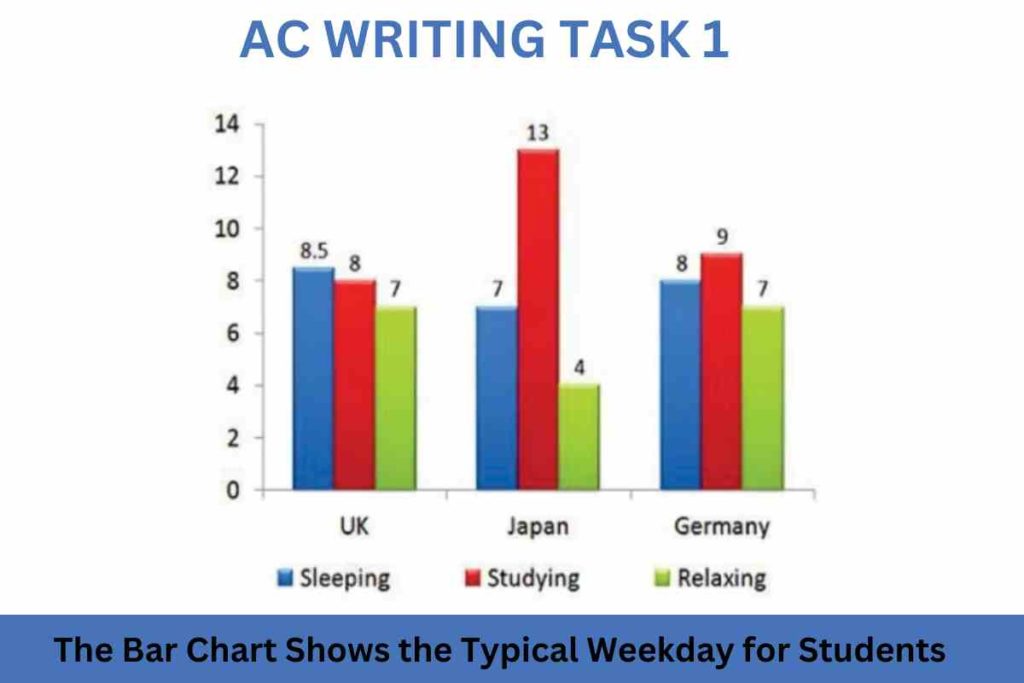
Overall, it is noticeable that, In Japan, students spend enough time on study and the least time relaxing among the other two countries. However, the UK and Germany have a similar percentage of relaxing pupils.
The percentage of scholar spending on sleeping is almost similar in both countries, UK and Germany at 8.5 and 8. but in Japan it is about 7 percent. Additionally, japan has the highest percentage of students who utilize their weekday on studying, which is more than two third of the UK students, but in Germany, it has around the same ratio.
Moreover, The UK and Germany have the same probability of relaxing scholar at 7 percent, but in Japan, almost half of the total pupils from both countries. Japan is the only country where the studying ratio is triple that of relaxing students.
![]()

Sample 2:-The Bar Chart Shows the Typical Weekday for Students
The given bar chart delineates information about how students spend their typical weekdays in the UK, Japan, and Germany. The data has been calibrated in numbers.
Overall, it is evident that the highest number of juveniles spend their time studying while the opposite could also be seen in Japan, which is relaxing. Another interesting point is that the statistics for the UK decrease gradually.
To begin with, Japan has the highest number of students who prefer to spend most of their time studying, that is 13, which is approximately double that of the kids who prefer sleeping. On the other hand, only four like to relax, which is the lowest number in a given graph. In the United Kingdom, the maximum number of learners use their time for sleeping followed by studying and relaxing; their figures are 8.5, 8, and 7, respectively.
In regards to further information, a minute difference of one is witnessed in the preference between sleeping and studying, which represent 8 and 9 in Germany. Moreover, after increasing to 9, the number of students who contribute their time to relaxing declined to 7.