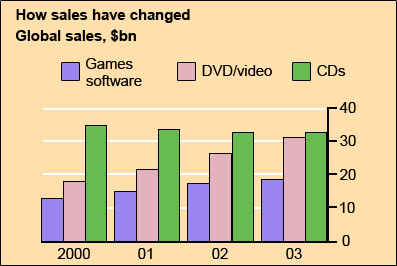
The chart below gives information about global sales of games software, CDs and DVD or video. Summarise the information by selecting and reporting the main features, and make comparisons where relevant.
The bar chart illustrates how universal sales of games software, CDs, and DVD or video have transformed within the period of four years( 2000 -2003).
Generally, CDs has the highest sales throughout the given period, which was approximately 35 billion dollars in each year, whereas games software has the lowest sales and the amount sold was almost half of CDs sales. However, its sales went up each year but never reached that of CDs and DVD or video.
CDs sales remain almost the same from the year 2000 to 2003 while that of DVD and games software rose every year. Initially, sales of games software were around 10 billion dollars which were almost half of DVD sales and two times lower than CDs sales. Despite that its sales increased every year, the highest sales didn’t reach 20 billion in 2003.
In 2000, DVD sales started with nearly 15 billion dollars, it then experienced an increment of roughly five billion dollars yearly till it reached its peak of close to 30 billion dollars which was almost the same with that of CDs in 2003.
Follow Us on IELTSFever Twitter for more updates
Also read: The Chart Below Shows the Changes that Took Place in Three Different Areas of Crime

