
The chart below shows estimated world illiteracy rates by region and by gender for the year 2000. Write a report for a university lecturer describing the information below.
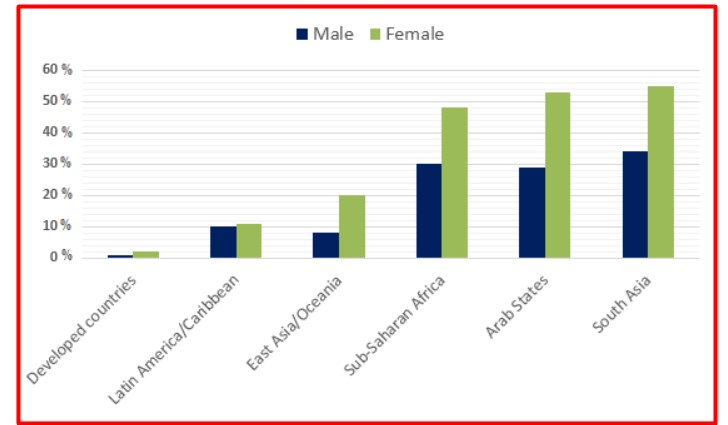
The bar chart reveals the illiteracy rate by region and gender for 2000. It compared six parts 0f the world. Developed countries generally have a low rate of illiteracy, almost 0 for both males and females. However, South Asia, Arab states and Sub Saharan Africa have the highest rate of illiteracy, respectively.
In these regions, the percentage of female illiterates is quite higher than male counterparts. In Arab states, around 30 % of males can’t write or read, whereas more than half of females are not literate. There is a minor difference in Sub Saharan Africa, the percentage of male illiterates are the same as that of Arab states, and about 50% of females didn’t attend school. The figures in south Asia are also hovering around; around one in3 males are illiterate. At the same time, higher than 50% of females are not literate.
In Latin America/Caribbean, the illiteracy rate is relatively low, nearly close to 10%. And males and females have equal chances for education.
In conclusion, developed countries have the least illiteracy rate, followed by Latin America/Caribbean. On the contrary, South Asia, Arab states and Sub Saharan Africa have the highest rate of illiteracy, respectively.
From the data, it is possible to infer that in the majority of parts of the world, males have a higher chance of attending school than females.
Follow Us on IELTSFever Twitter for more updates
Discover more from IELTS Fever
Subscribe to get the latest posts sent to your email.


