


The Chart Below Shows the Amount of Energy Generated from Wind in Four Countries from 1985 to 2000. Summarise the Information by Selecting and Reporting the Main Features, and Make Comparisons Where Relevant.
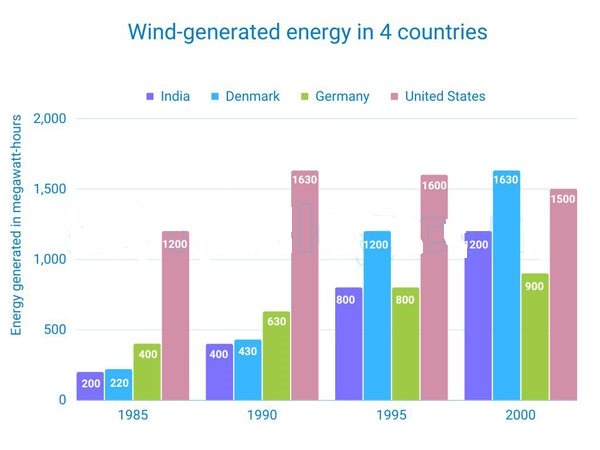

The bar chart illustrates the quantity of energy generated from wind in four different nations ( India, Denmark, Germany and the United States of America ) between 1985 and 2000. Units are measured in megawatt-hours.
Overall, over the period of ten years, the USA dominated the production of energy, except in the year 2000, which was replaced by Denmark. Whereas India had significantly lower energy, there was a considerable gap in energy production between the United States and other countries in 1990. Followed by the same amount of energy generated in India and Germany in 1995.
There was a myriad of high energy within the United States over the period of ten years, with a maximum of 1630 megawatt-hour in 1990. Although from 1985 to 1990, the generation of energy in India was the least, the production increased relatively with time, as it did for Denmark and Germany at 200,220,400 and 400, 430, 630 megawatt hours respectively.
In 1995, the energy generated in both India and Germany was at exactly the same level, at 800 megawatt-hours. Moreover, the generation increased by 400 and 100 megawatt hours, respectively. On the other hand, at the end of the period of time given, the Energy production predominated by Denmark at 1630 megawatt hours instead of the US, which had 1500 megawatt hours.