The Chart Below Shows the Amount of Money Spent on Fast Food in Britain per Week. The graph shows the Trends in The Consumption of Fast Food. Write a Report for A University Lecturer Describing the Information Shown Below.
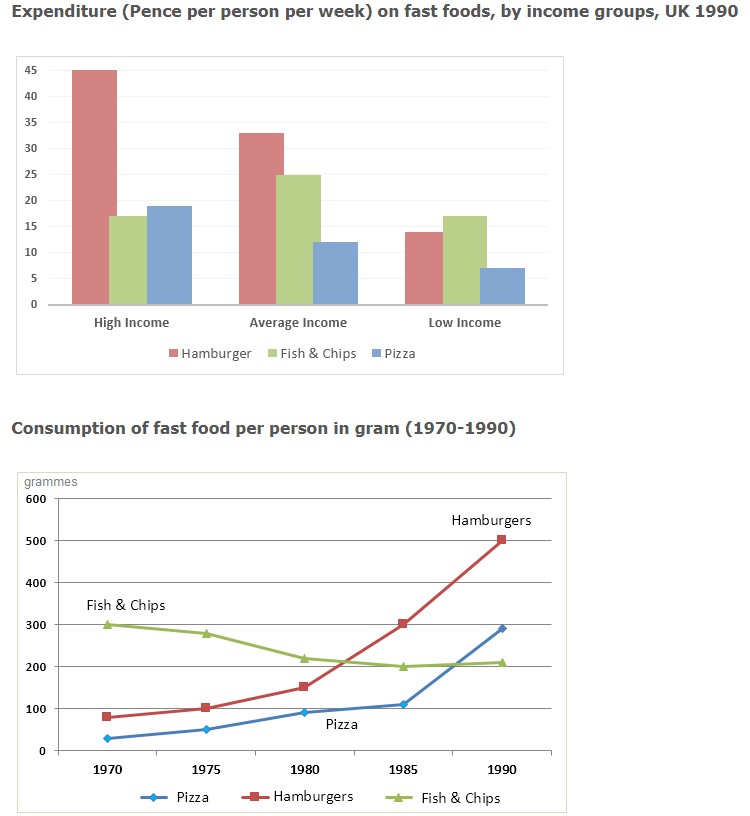
Britain’s Expenditure on fast food per week is illustrated in the chart, along with the graph showing the trends in fast food consumption. The chart shows the fast-food expenses by different income groups, whereas the graph gives the data on fast food consumption for the past three decades from 1970 to 1990.
At first, the expenditure by different income groups on fast food was divided into three groups (High, Average, and Low). Fast foods that are taken into account are Hamburgers, Pizza, Fish, and Chips. This shows that depending on income, the amount of income ranges, and the amount of fast food consumption increases from low to high. However, fish and chips maintain a constant consumption rate despite the income.
However, fast food consumption per person in grams from 1970 Increased till 1990 apart from fish and chips. Hamburgers and pizza intake would seem like below 100 grams, but over the years, it increased to 500 and 300 grams, respectively. In contrast, Fish and chip intake was reduced to 200 grams from 300 grams.
To sum up, Junk food intake is increasing as per income. Over the past three decades, from 1970 to 1990, the quantity of Pizza and hamburger intake increased, whereas fish and chips declined.
Follow Us On IELTSFever Facebook Page For More Updates
Discover more from IELTS Fever
Subscribe to get the latest posts sent to your email.

