The chart below shows the global sales of different kinds of digital games from 2000 to 2006
SAMPLE ANSWER :
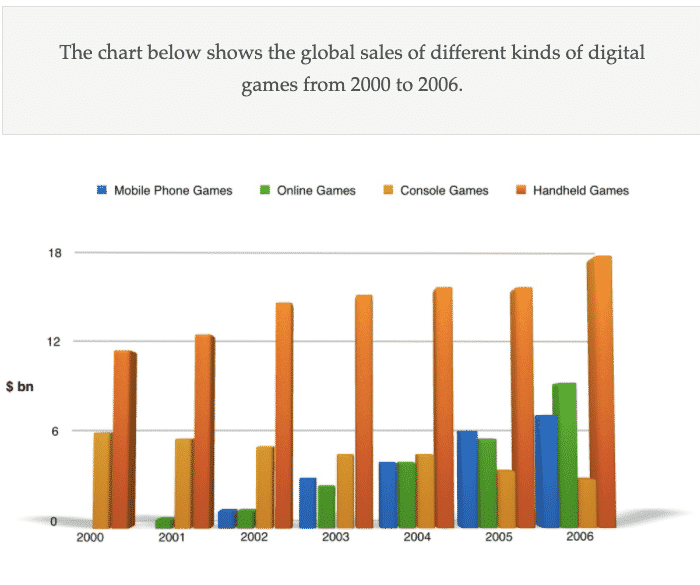
The bar chart represents the global sales of various digital games from the year 2000 to 2006.
OVERALL:
Overall, we see that handheld games have always been popular among people as they have ruled the gaming market with sales upto 18 billion dollars, which is higher than mobile phone games, online games and console games.
PARAGRAPH 1:
When we look into the graph for the year 2001 and 2002, it is seen that online games were starting to emerge at that time. And for the following year, online games began to gain popularity as shown by the increase in its sales from nearly 1 billion dollars in the year 2002 to around 10 billion dollars in the year 2006. Similarly, mobile phone games came around 2002 with sales up to 1 billion dollars and the sales increased thereafter.
PARAGRAPH 2:
Unfortunately, from the year 2000 to 2003, there has been a decline in the sales of console games with sales up to 6 billion dollars in 2002 to approximately 4.5 billion dollars in 2003. The graph remains constant for console games for the following year but there has been a steep decline in its sales since then, with sales approximating to almost 3 billion dollars in 2006.
SAMPLE ANSWER 2:
The bar chart illustrates the global sales of mobile phone games, online games, console games and handheld games from 2000 to 2006. The measurement is done in billions of dollars.
OVERALL
Overall, it can be seen that from the initial year till the last the sale of handheld games remained high among these games. Mobile phone games, online games and handheld games experienced an upward trend whereas console games showed a downward trend.
PARAGRAPH 1:
In the first two years, no data had been shown for mobile phone games followed by online games. The sale of online games commenced in 2001 which was 1 billion dollars. Afterwards, their sales increased considerably throughout the period. In 2002 and 2004 the sale of both the games remained equal at around 2 and 4 billion dollars respectively. There was an increase of 3 billion dollars in the sale of mobile games and the sale of online games reached to 10 billion dollars in 2006.
PARAGRAPH 2:
The sale of console games dropped gradually over the period while handheld games increased steadily for the given time period. In 2002, the sale of console games was approximately 6 billion dollars and the sale of handheld games was doubled the sale of console games in that very period. In 2006, the sale of handheld devices increased to 18 billion dollars whereas the sale of console games reached to the half of its initial period (2000).
THIS IS END OF ACADEMIC WRITING TASK 1(The chart below shows the global sales of different kinds of digital games from 2000 to 2006)
Discover more from IELTS Fever
Subscribe to get the latest posts sent to your email.