 Sample 1: The Chart Below Shows Waste Collection by A Recycling Centre from 2011 to 2015
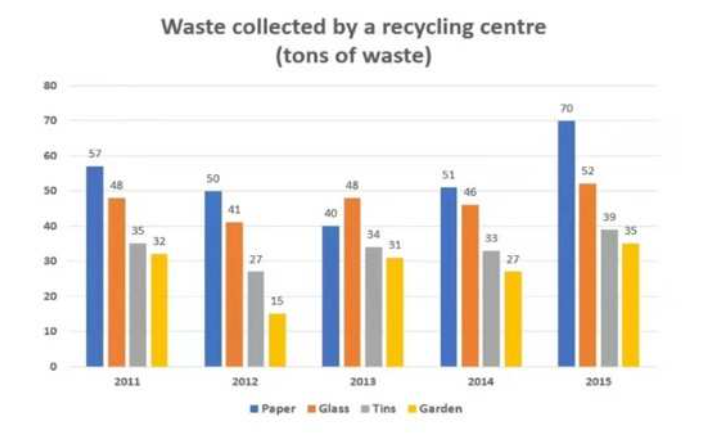
The chart below shows waste collection by a recycling centre from 2011 to 2015.
The bar graph demonstrates the information about waste collection in multifarious items like paper, glass, tins and gardens by recycling companies in the time period of 2011 and 2015.
Overall, it is explicit from the histogram that the highest amount of collection was acquired by paper; however, the vast declination was measured by garden wastage.
To commence with, in 2011, the waste of paper had significantly ascended to around 57 tons. After that, it gradually decreased to 50 tons and 40 tons in 2012 and 2013. Nevertheless, tins and glass waste were 48 tons and 35 tons in 2011. Subsequently, it moderately escalated by about 41 tons in glass collection, while tin waste declined by approximately 27 tons. The garden waste was calculated with 32 tons, 35 tons, and 31 tons in three different years.
On the other hand, both varieties of wastage counted with an upward trend of around 48 tons and 34 tons in 2013. On the contrary, in 2014 and 2015, there was a significant rise in paper waste, with 51 tons and 70 tons, respectively. Apart from this, glass, tins and garden showed by sequence position with 46 tons, 33 tons and 27 tons. Lastly, glass wastage increased by 52 tons, tins by 39 tons and garden waste by 35 tons in the time period of 2015.
Sample 2: The Chart Below Shows Waste Collection by A Recycling Centre from 2011 to 2015
The given bar chart illustrates information about four different types of trash (paper, glass, tins, and garden) collected by disposal areas over a five-year period between 2011 and 2015. Units were measured in tons.
Overall, the bar graph reveals that waste from paper collection was the highest in four years; only in the middle of the period was it the second-highest trash collection that was collected by recycling centres. Another interesting fact is that waste collection from all four areas increased at the end of the period.
At first, in 2011, paper waste collection was the highest, at 57 tons, followed by 48 tons of waste from glass and 35 tons and 32 tons of trash from tins and gardens. In 2012, the trash collection from three areas decreased rapidly, and for gardens, the waste collection declined by half. The next year, they went the opposite for waste collection for glass, tins, and gardens, whereas only paper waste collection decreased.
In 2014, only paper waste collection increased significantly to 40 tons, and as for the other three, it went down slightly: 46 tons of waste from glass, 33 tons from tins, and 27 tons from gardens. At the end of the period, in 2015, paper waste collection reached a peak of 70 tons, and in other areas, waste collection also rose somewhat.
Discover more from IELTS Fever
Subscribe to get the latest posts sent to your email.


