


The Chart Illustrates Teenagers’ Consumption of Three Kinds of Fast Food in Mauritius from 1985 to 2015. Summarise the Information by Selecting and Reporting the Main Features and Make Comparisons Where Relevant.
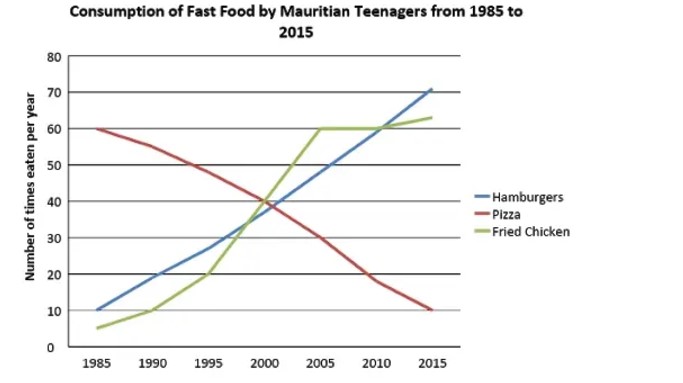
Overall, the most notable trend is that hamburger and fried chicken consumption increased significantly, while pizza consumption declined steadily throughout the period.
In 1985, pizza was the most frequently eaten fast food, at around 60 times per year. However, its popularity dropped continuously, falling to about 40 times in 2000 and reaching just 10 by 2015, making it the least consumed item by the end of the period.
Hamburger consumption showed the opposite pattern. Starting from only 10 times per year in 1985, it rose gradually and matched pizza at about 40 times per year around 2000. After that, it continued to climb sharply to peak at roughly 70 by 2015, becoming the most popular fast food among teenagers.
Fried chicken consumption also increased, though in a more variable manner. It rose steadily from about 5 times per year in 1985 to around 60 by 2005. After this rapid growth, the trend levelled off slightly, ending at around 65 times per year in 2015.
In summary, while pizza fell out of favour, hamburgers and fried chicken became increasingly popular, with hamburgers experiencing the most dramatic growth.