The line graph below shows changes in the amount and type of fast food consumed by Australian teenagers from 1975 to 2000.
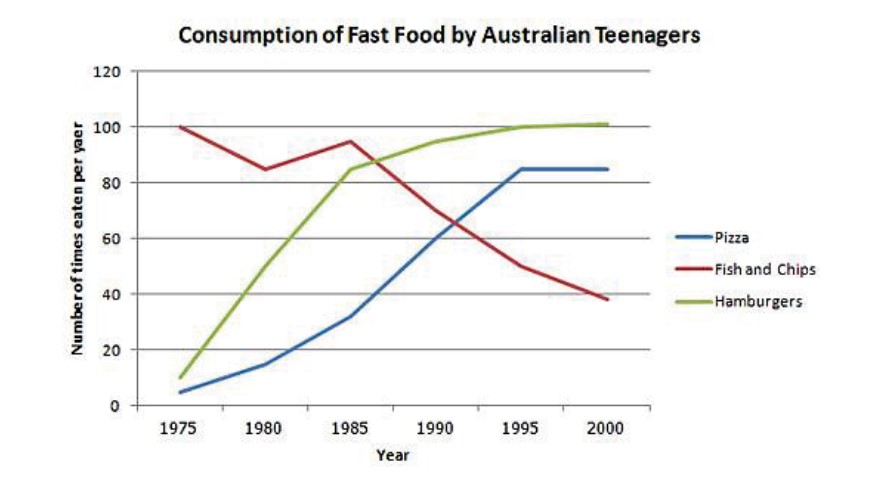
The line graph illustrates the consumption of three types of fast food by Australian youngsters during the period 1975 to 2000. Overall it is immediately apparent from the graph that, both pizza and Hamburgers were in increasing trend whereas the fish and chips were gradually decreased
To begin with, in 1975, the consumption of pizza and hamburgers was almost the same number of times (nearly 15 times per year). However, the depletion of hamburgers rose sharply in the next three years, approximately 80 times per year. After that, it slowly increased and stabilized in both 1995 and 2000.
To continue, the emaciation of pizza by Australians gradually increased peak of almost 80 times per year from 1975 to 1995. After that, the consumption of pizza remains stable. In contrast, fish and chips consumption began at 100 times per year in 1975. Subsequently, there was a slight fluctuation in the year 1985. Thereafter it dropped sharply from 1985 to 2000 finish just under 40 times.
As a comparison, it can be seen that in 2000 the highest depletion of fast food by Australian adults was hamburgers whereas the least consumption was fish and chips.
Follow Us on IELTSFever Twitter for more updates
Discover more from IELTS Fever
Subscribe to get the latest posts sent to your email.