


The Chart Shows the Average Number of Hours Each Day that Chinese, American, Turkish and Brazilian Tourists Spent Doing Leisure Activities While on Holiday in Greece in August 2019. Summarise the Information by Selecting and Reporting the Main Features and Make Comparisons Where Relevant.
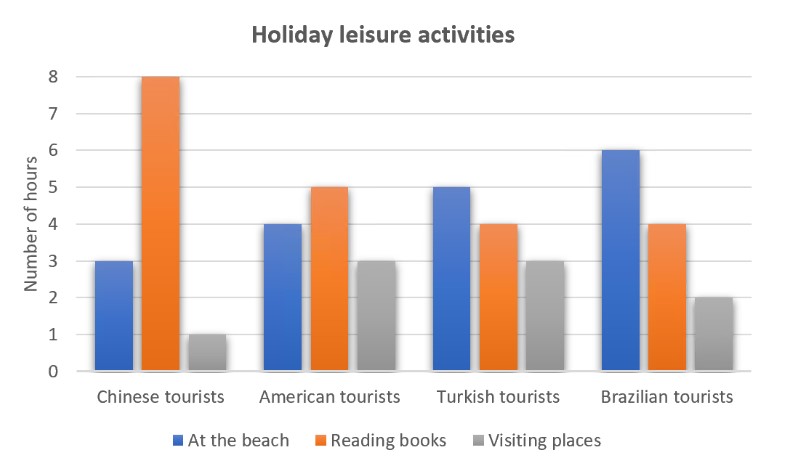

The bar charts compare the average number of hours per day spent by holidaymakers from China, the United States, Turkey, and Brazil on leisure activities during their vacation in Greece in August 2019.
Overall, it is clear from the chart that a considerable number of Chinese tourists spent more time reading books than on other activities. Tourists from Turkey and Brazil spent the same number of hours reading books, while American and Turkish tourists spent similar amounts of time visiting different places in Greece. On the other hand, Brazilians loved playing at the beach more than the rest of the tourists.
Although a significant number of hours were spent by Chinese tourists reading books at 8 hours, visiting places was their least favourite activity at 1 hour. Moreover, 3 hours were spent at the beach. American and Turkish tourists spent similar amounts of time visiting places, at 3 hours, with a 1-hour difference compared to Brazilian tourists.
Both tourists from Brazil and Turkey noted sharing the same amount of hours spent reading books at 4 hours, even though the Brazilian tourist had the outstanding hours of more than 1 hour at the beach compared to the Turkish tourist, who had 5 hours.
Follow Us on The IELTSFever Facebook Page for more updates